As the number of Android users continues approach 1B devices, more and more startups are looking to deploy complementary applications on Android, in addition to their iOS applications. Some startups are beginning looking to launch on Android first. But the dynamics of the Android app store are quite different from iOS. In fact, they are much more challenging for startups.
Like iOS’s app store, Android’s app store also ranks applications. But the ranking system is very different in four key ways:
TL/DR
- Android seems to tune/control the charts to encourage fewer large movements of applications within the rankings than iOS. The rankings aren’t wholly calculated from the previous hour’s downloads like iOS.
- As a result, it’s much harder for new entrants to break into the top of the charts on Android than iOS. Existing top applications are much better insulated from competitors than with Apple.
- But, the decreased volatility means paid customer acquisition is much more cost-effective on Android, presuming the app’s engagement and monetization are similar across platforms, because if your app can reach the top of the charts, it’s much less likely to be dethroned and the cost-per-install of the paid users can be amortized over a much larger organic user base who discovers the app by virtue of the high rank.
- The competitive categories vary significantly from Android to iOS. This means there is probably an arbitrage opportunity to bring the best apps from iOS to Android.
To tell the real story behind climbing these app stores, I’ve been gathering ranking data from the app stores for the past two weeks.
Android Ranking Movements are Much More Subtle than Apple
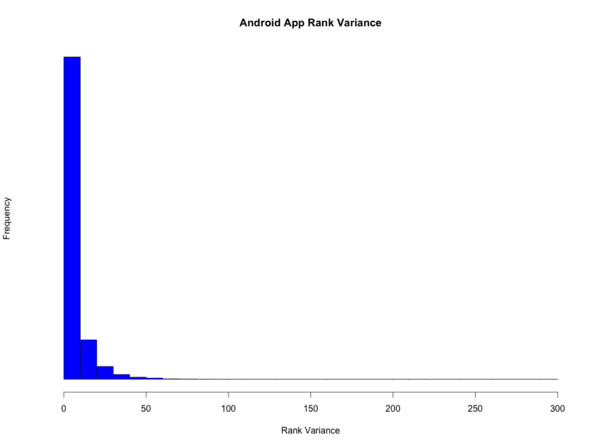
In a given day, the average iOS app could move up to 50 ranks up or down. The typical Android app moves up to 12 slots.
Below are two charts comparing the variances of all applications on each store in a two week window.
An average iOS application might vary by fifty to one hundred ranks or more in a two week period.
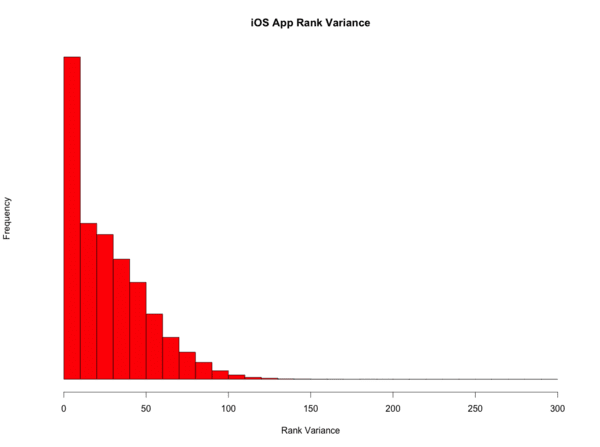
On the other hand, the same application on Android wouldn’t see more than a 50 rank fluctuation.
Volatility Difference is Pretty Consistent No Matter Your App Rank
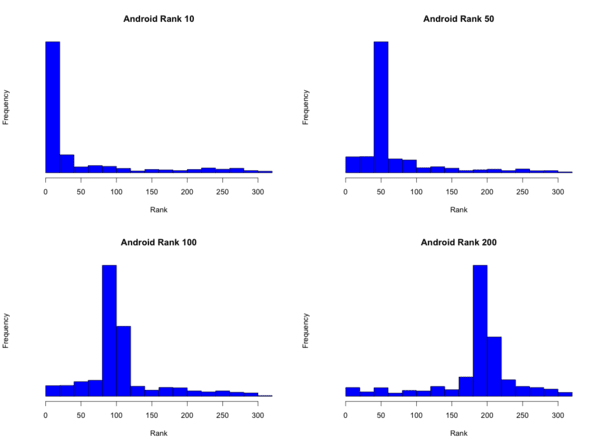
Now you might point out that apps in the lower ranks (200-300) should move much more than those apps in the top 10. Perhaps that explains the difference between Android and iOS. But that’s not true. iOS has larger variances at every rank bucket.
Compare these two charts that show the variance of applications that reached rank 10, 50, 100 and 200 at some point during my test.
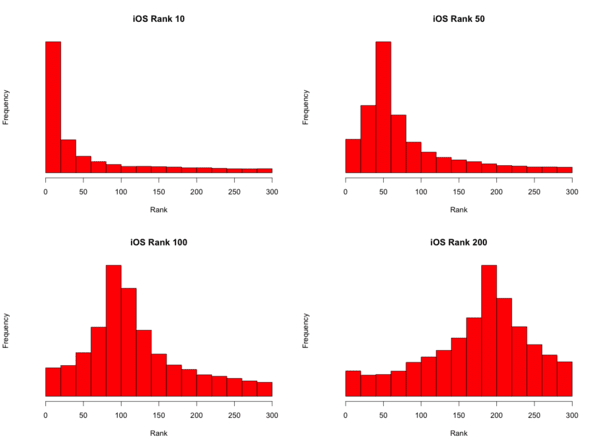
Android apps tend to stay put where they are much more than iOS no matter if they are ranked three, thirty or three hundred.
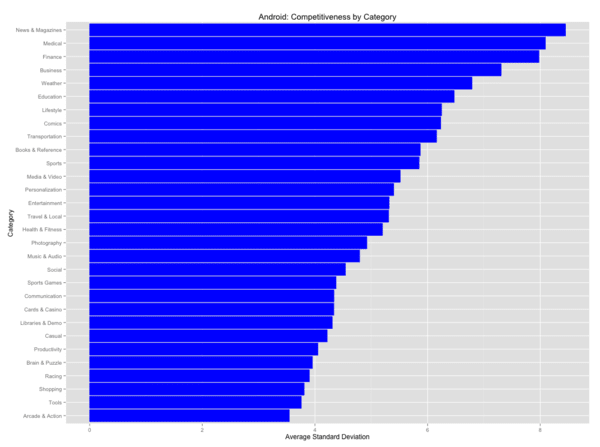
Competitive Categories
Below is one way of looking at competitiveness by category for each of these app charts. The more the average application can change rank within a category, the better the quality of competition exists (perfect competition in the economic sense). Where variances are low, there is something like an oligopoly - for example ten apps that dominate the top ten.
Click on the images to enlarge them.
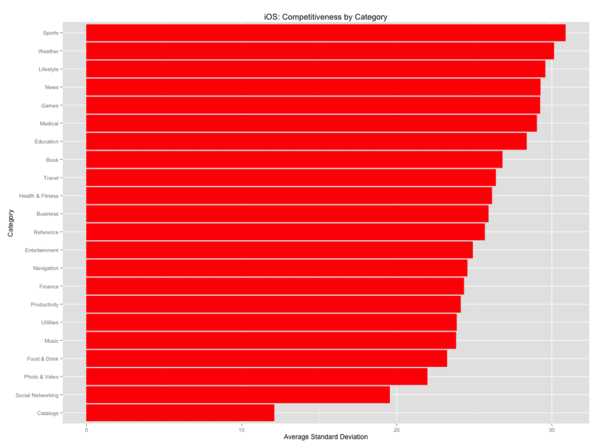
On the other hand, Android’s most oligopolistic categories are Arcade & Action Games, Tools, Shopping and Racing Games. The best categories for new entrants are News, Medical, Finance, Business.
What Got You Here Won’t Get You There
Android’s market isn’t a carbon copy of Apple’s. Android requires a distinct strategy considering the much stronger tendencies to reinforce the top applications within Google Play. There are many drawbacks for startups when launching on Android but the addressable market may ultimately render those challenges moot.
Data Caveats
With any analysis, there should be lots of caveats
- This is a two week study with a sample size of about 25k applications and roughly 1 data point per app per day for 14 days. - Android may seem to have a less accessible app store because they are fewer quality apps and so the best bubble to the top and stay there. I can’t make a determination either way with this data. - Looking at standard deviations and variances implies that the underlying data follow a Gaussian distribution and these data may not.