This post is part of a continuing series evaluating the S-1s of publicly traded SaaS companies in order to better understand the core business and build a library of benchmarks that might be useful to founders.
Box is a 1000+ person company providing collaboration and document sharing software. We had previously analyzed the business when the company filed their first S-1. Yesterday, the company filed an updated version of their S-1. In the past two quarters, some of the key financial characteristics trajectory have improved materially.
In the next seven or so charts, we’ll explore how the Box business has evolved. We will explore revenue growth, average revenue per customer, sales efficiency, payback periods, net income, gross margin and engineering spending. In these plots, I’ve used New Relic’s colors as a consistent legend. Box company data is powder blue, median values are black, and other company values are gray.
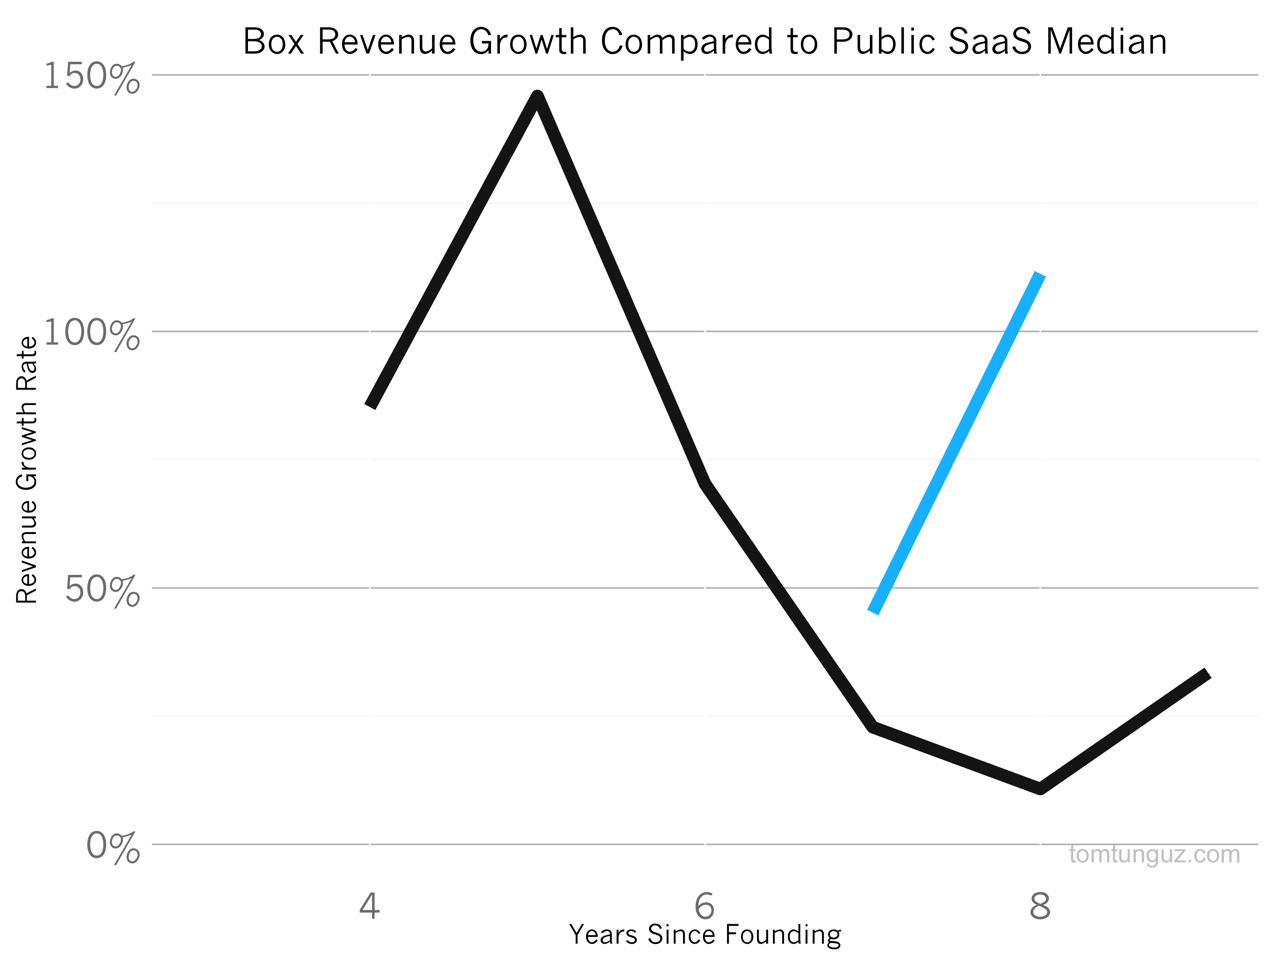
While the company took a little longer to hit its stride than most, Box is growing revenues incredibly quickly. In the last months, the company will have grown more than 111%, and astounding figure for company generating more than $120M in revenue. The median publicly traded SaaS company achieves those growth rates at $13M in revenue and is unable to sustain them past $35M in trailing twelve months revenue.
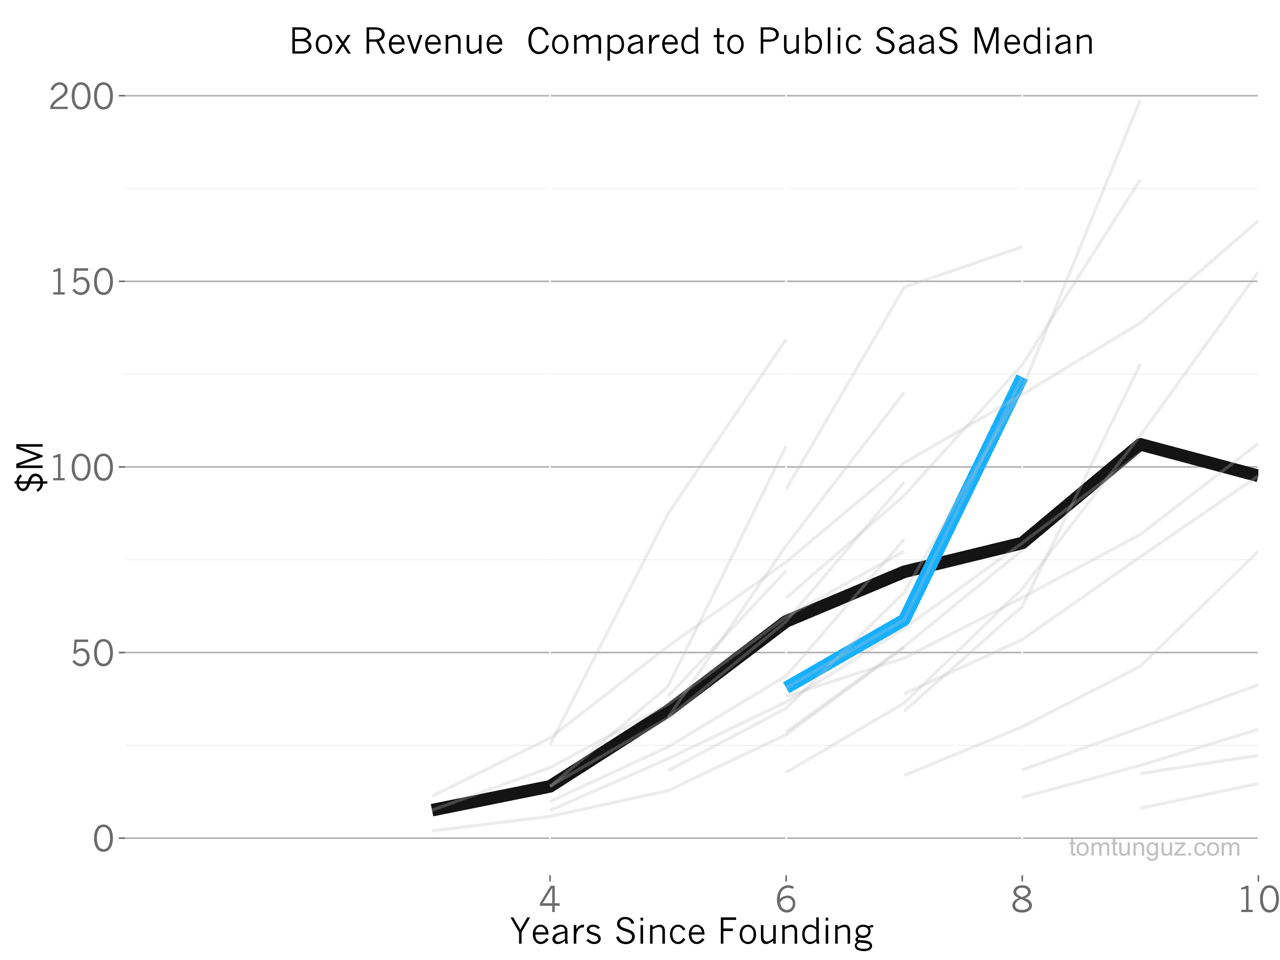
This extraordinary growth is readily apparent in this chart. In year six, Box was relatively close to the median four total revenue that in the last 12 to 18 months, the company has clearly pulled away and demonstrated exceptional revenue growth.
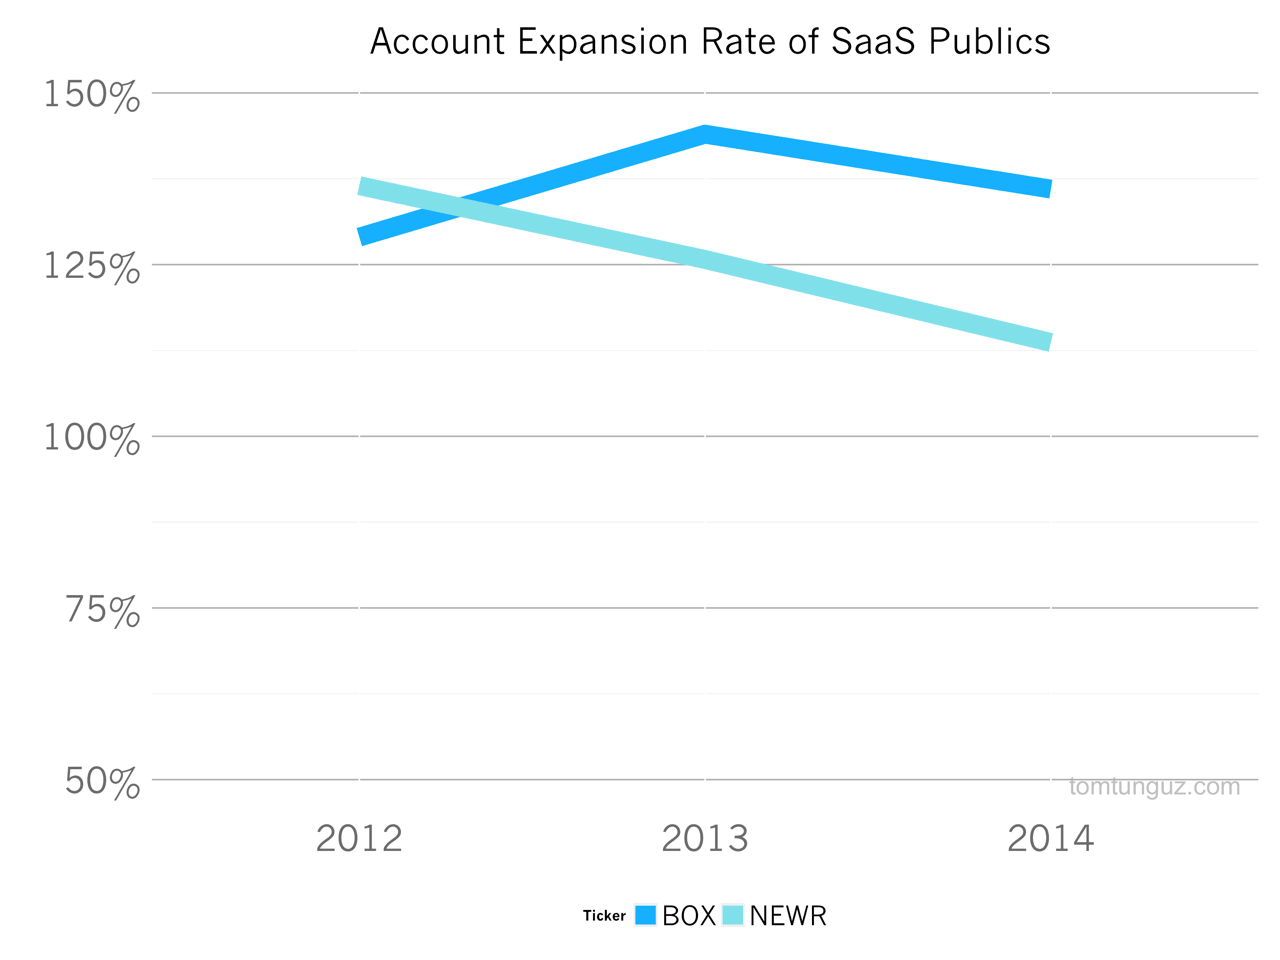
File sharing products are viral. When one user adopts Box to share files, eventually many other users within a company will want to share files similarly to collaborate. This behavior engenders best-in-class account revenue expansion. Box reported greater than 30% annual account growth for each of the previous three years. To compare, I’ve plotted New Relic’s account growth by year. Box been able to sustain greater than 30% negative net churn figure, while New Relic’s has been declining each year at about 9%. In short, this behavior is a massive and incredibly valuable engine of revenue growth for the business.
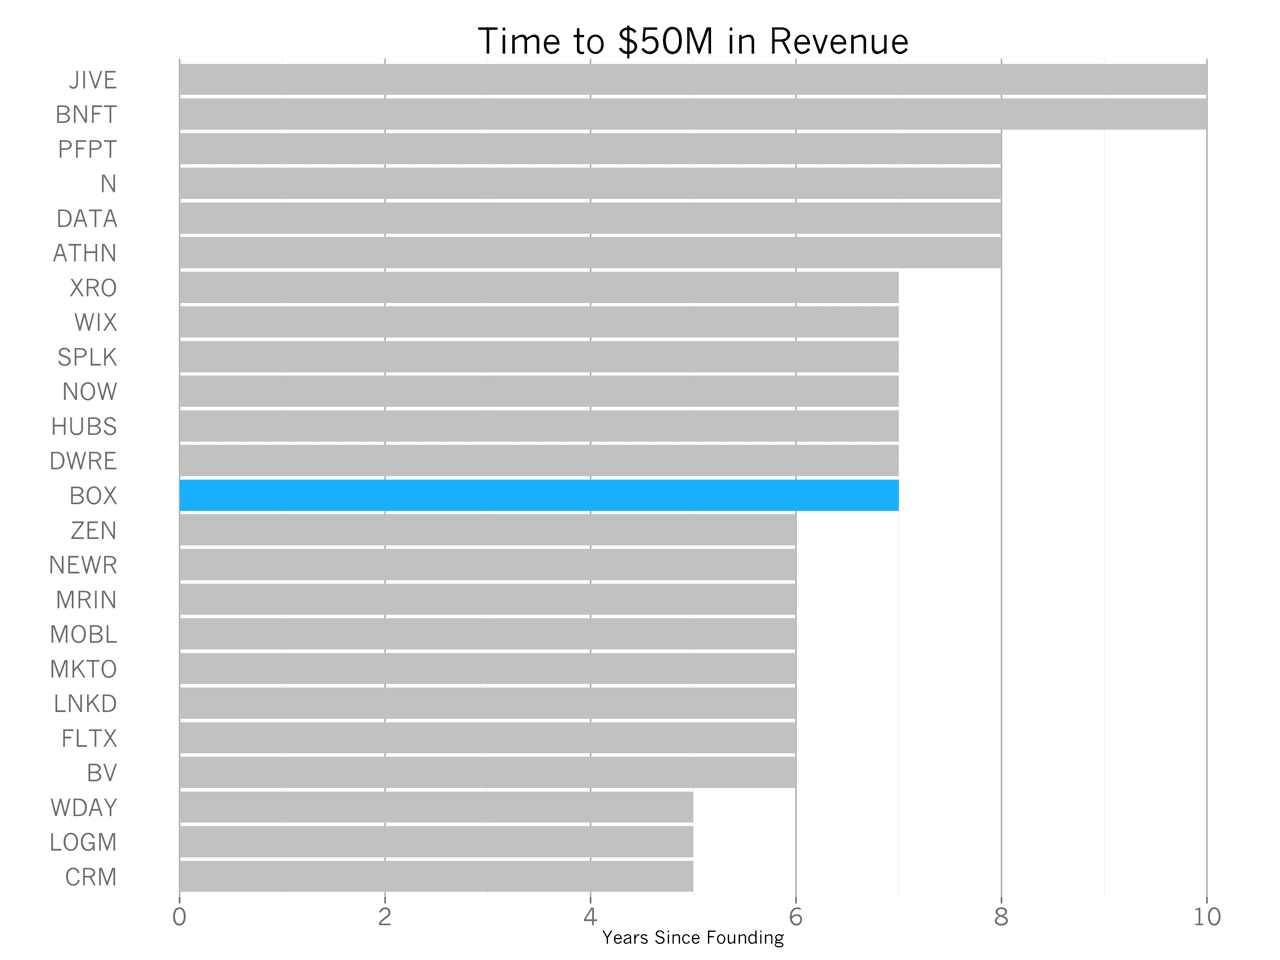
Box took six years to reach $50M in revenue and is among great company including Hubspot, Demandware, Splunk and ServiceNow. But as we’ve seen in the previous charts, Box’s initial ramp was slower, followed by meteoric revenue growth.
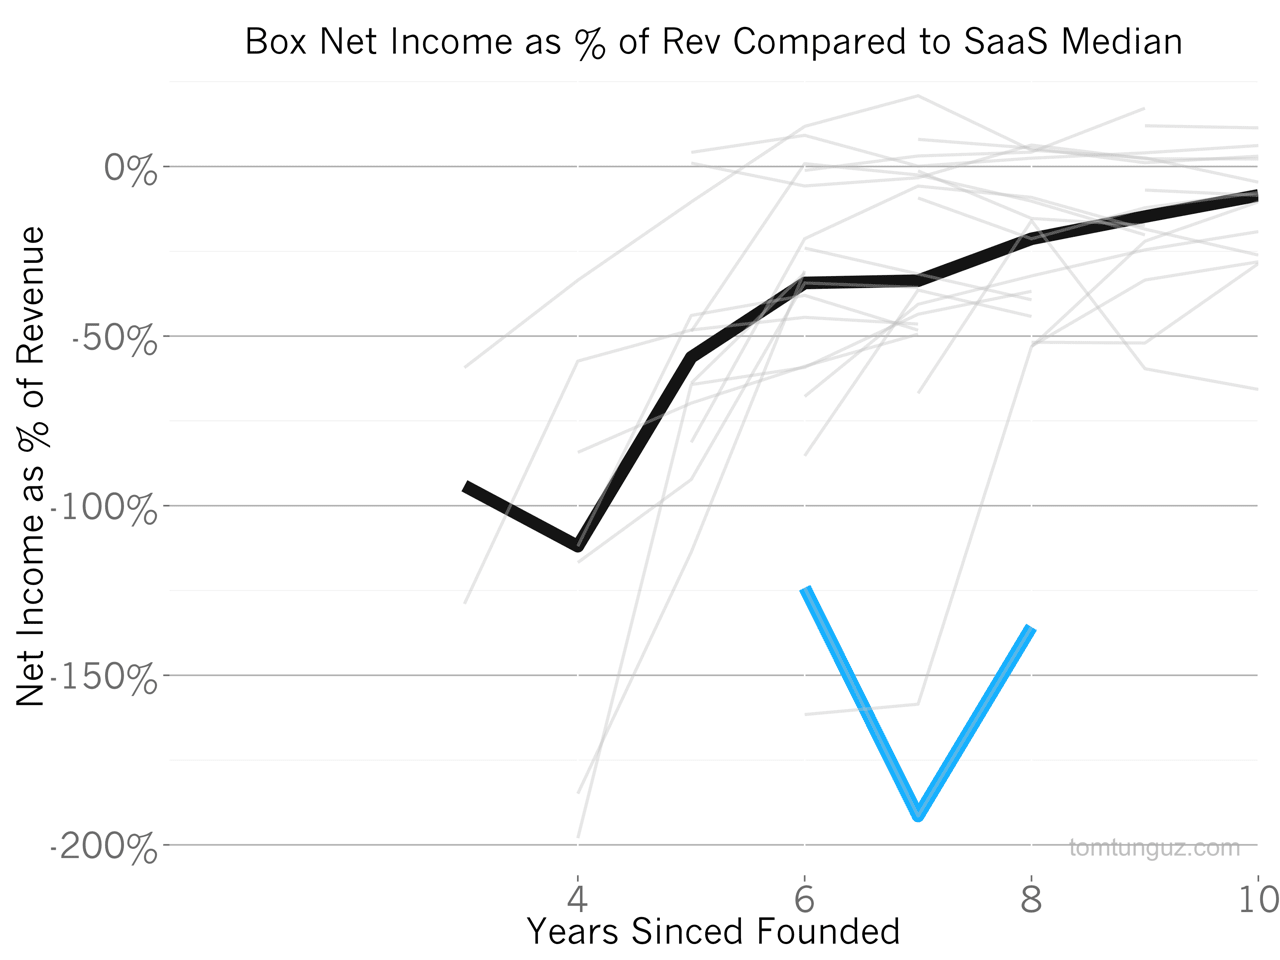
In order to achieve this growth, Box has invested a huge amount of capital. In fact, the business has outspent almost every other company to achieve their revenue. However, in the last year, the business has reduced its investment and decreased their burn rate. When the company filed their first S-1, the company reported net income as a percent of revenue at -191%. This figure has dropped by 30% to -136% in the last year, to about $168M.
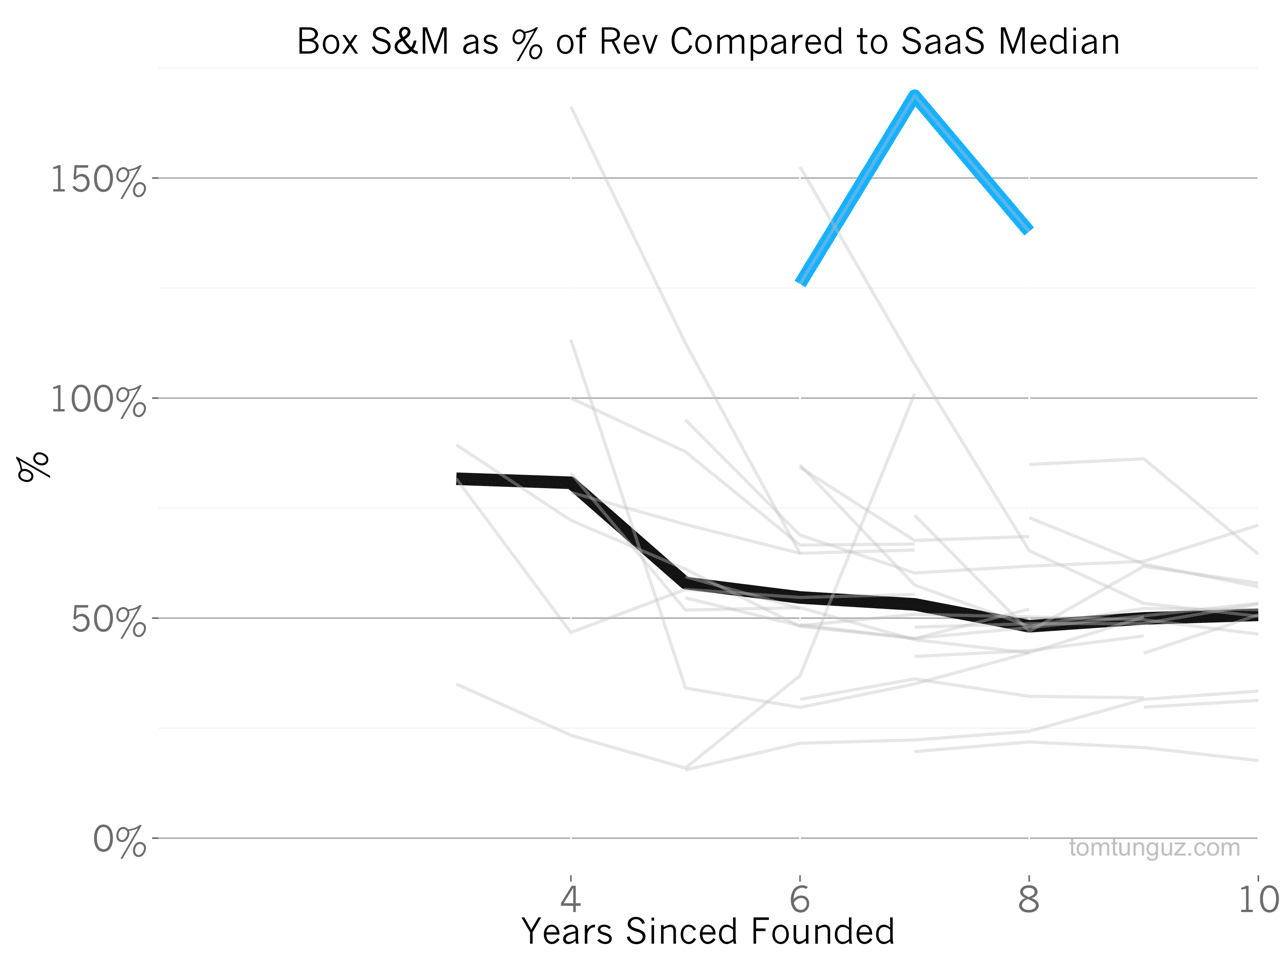
To achieve this cost reduction, Box reduced its investment in sales and marketing by 19%, from 169% of revenue to about 138% of revenue. At this pace, the company is still far above the norm. The tradeoff is that the company is also growing at 10x the rate of the median.
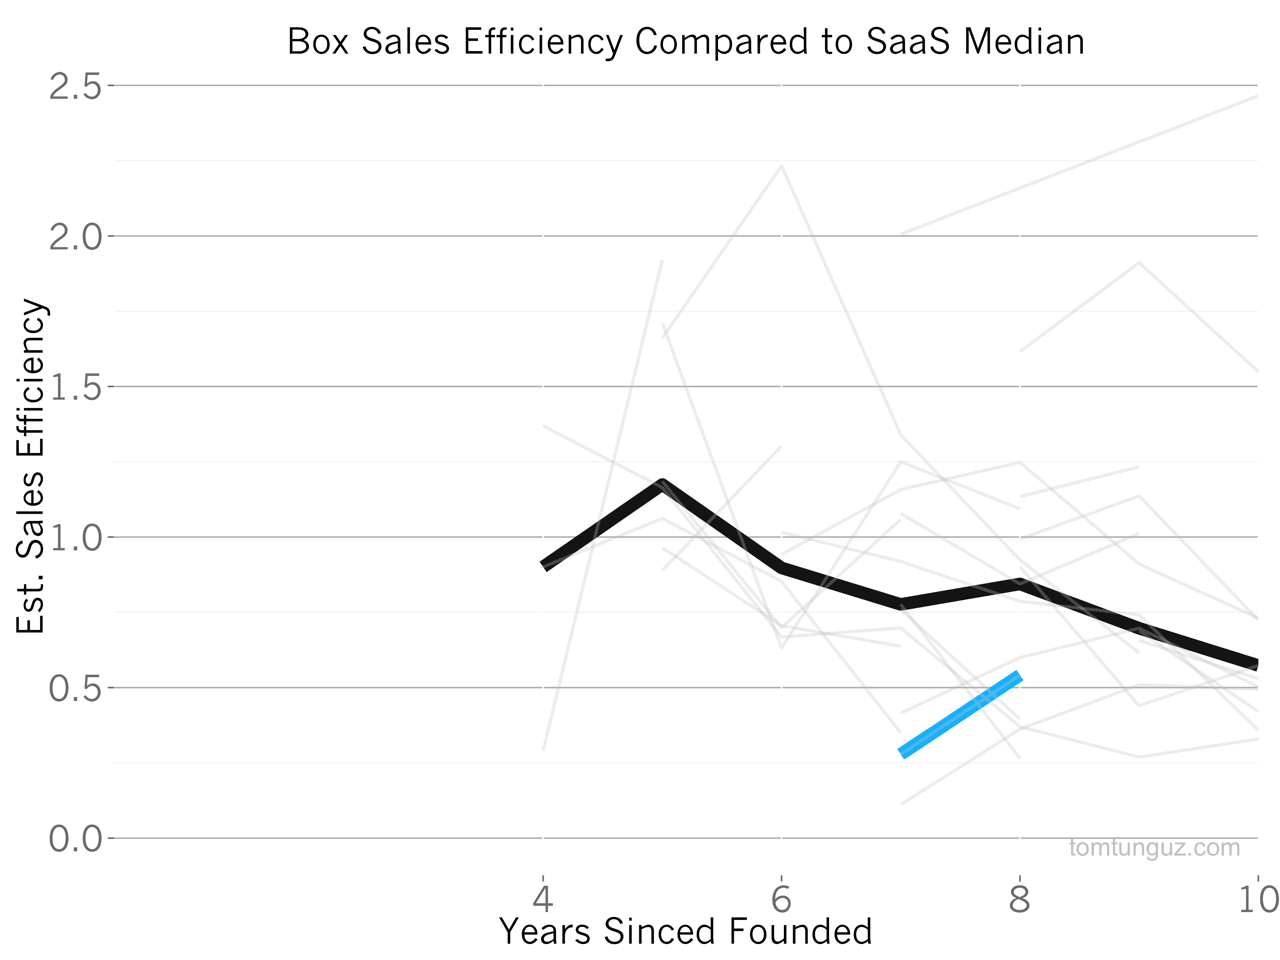
As a result of a decrease in sales and marketing investment, Box’s sales efficiency, a measure of how much revenue a dollar in sales and marketing yields, has doubled from 0.27 to 0.54, which is about 36% less than the median. This is a good sign for the business, especially when considering the average account expansion pattern noted above.
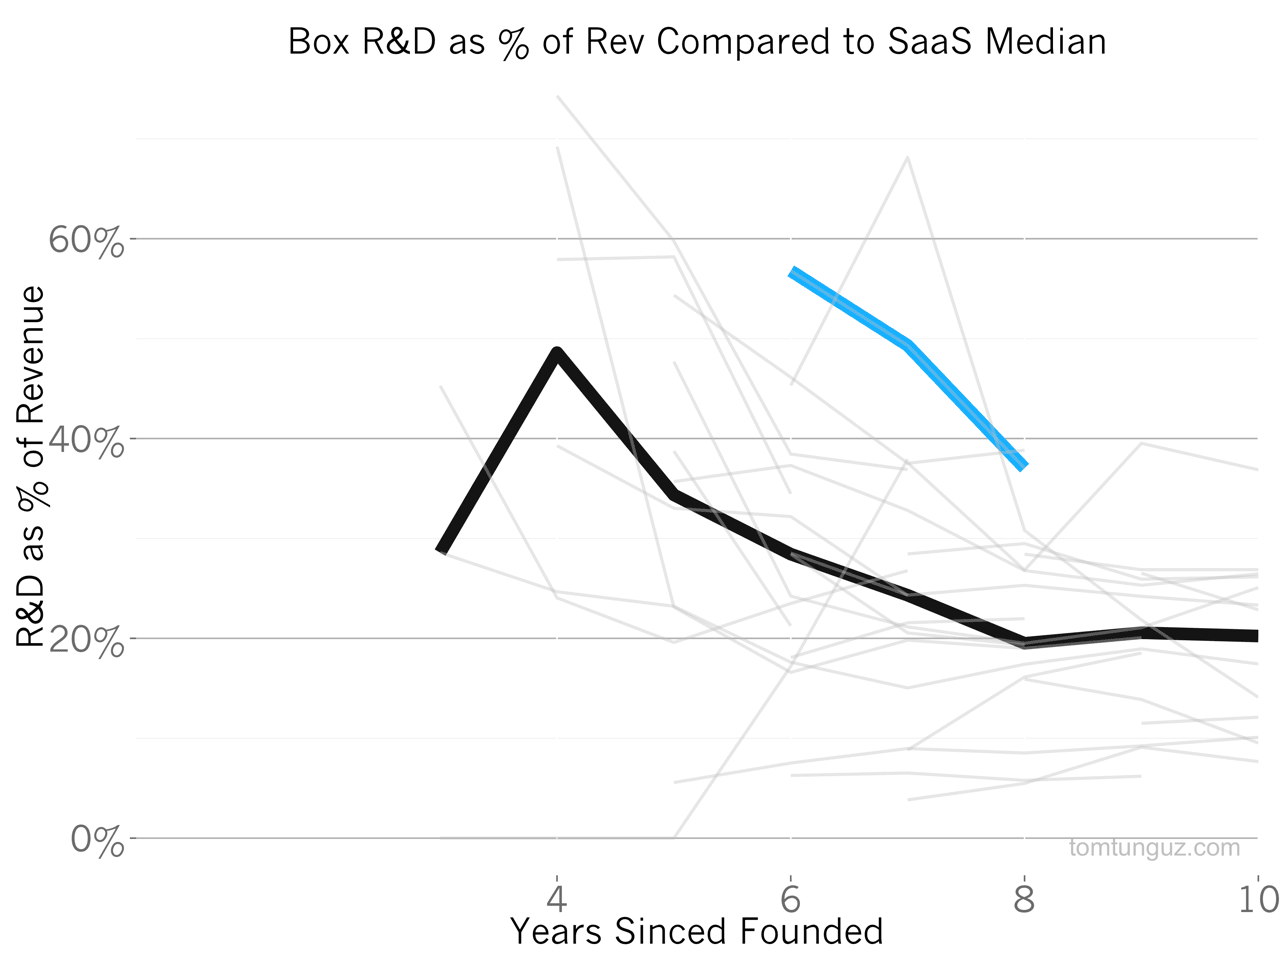
In addition to relative sales and marketing expense reductions, the business reduced its investment in engineering, as a percentage of revenue from 50%+ to 37% in the last twelve months. While this figure is substantially above companies of a similar age, it’s consistent with companies in their fifth year, who on average are growing as quickly as Box.
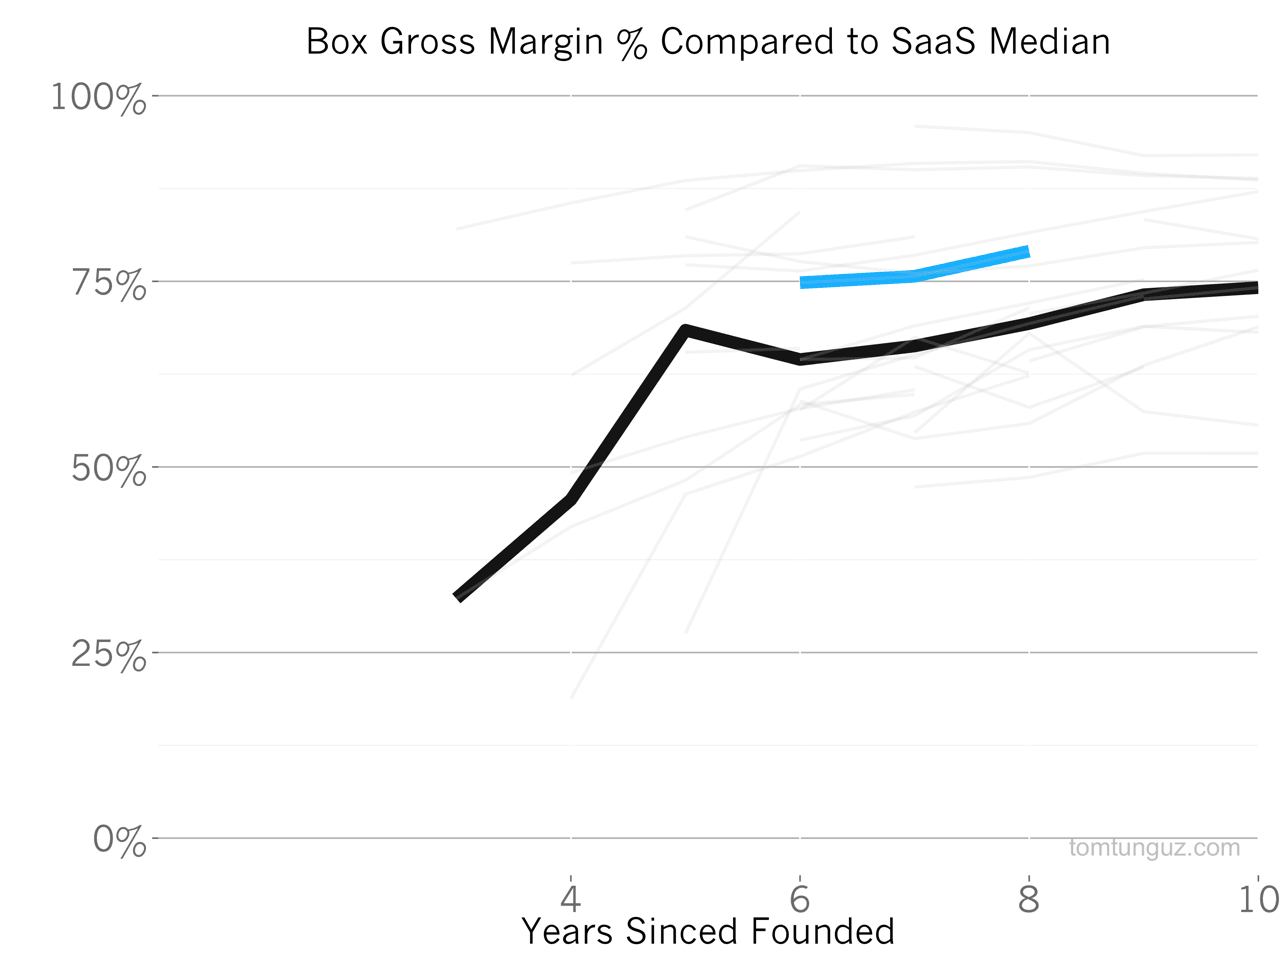
Box’s gross margins are 10 percentage points better than the median, at 79% and continue to rise as the company grows. Higher gross margins enable the company to invest more in customer acquisition and point to a business with increasing efficiencies.
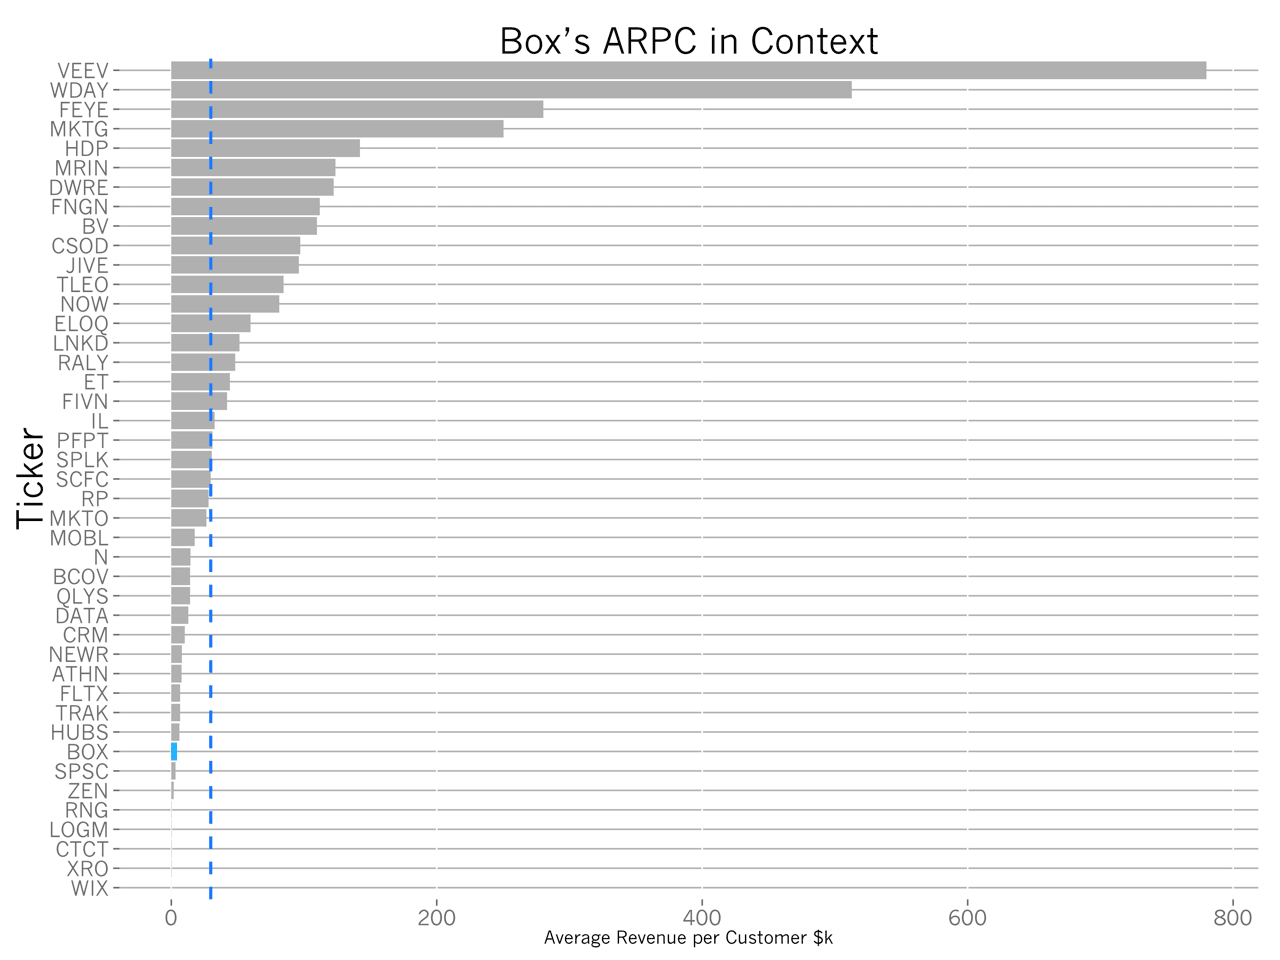
The average customer pays Box about $5000 per year. Given the number of free accounts, this measure is likely a bit misleading. The largest customer has more than 95,000 seats and is likely worth more than $1M, but unfortunately, we don’t have a distribution of customer account size or other proxy to get a better sense.
Overall, Box has dramatically changed its investment strategy in sales & marketing and engineering investment, likely through a decrease in hiring, to reveal a very special business underneath. The company has best-in-class negative net churn, improving sales efficiency and exceptional revenue growth. Some may still point to much higher than median losses, but this objection will likely disappear with time. The company is proving an ability to cut costs by 30%, improve efficiency 50%, and still grow revenue 111% annually.