Anyone who has ever penned a blog post has asked, how long should this post be to maximize viewership? I’ve often wondered the same thing, particularly in the moment before I click the publish button and broadcast a perhaps-too-short-perhaps-too-long post into the Interwebs.
I’ve written 256 posts in the past 18 months and I sought to understand the impact of word count on every metric I could measure: page views, time on site, time on page, bounce rate, exit rate, retweets and favorite activity.
Here’s the data. In short, post length has no meaningful impact viewership, engagement or sharing.
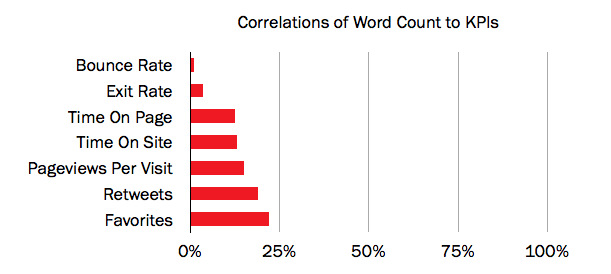
Below is a chart depicting the correlation of word count to six key metrics. In each of these cases, the correlations are small (<25%) and relatively speaking insignificant predictors of traffic.
Metrics
| Bounce rate | The fraction of visitors who came to the site to view a post and left without reading any others |
| Exit rate | The fraction of visitors who came to the site on another page and left on this post |
| Time on page and site | Self-explanatory |
| Page views per visit | The number of other blog posts read during a visit |
| Retweet frequency and Twitter favorite activity | The number of times a post is retweeted or favorited on Twitter, which often means saved to read later. |
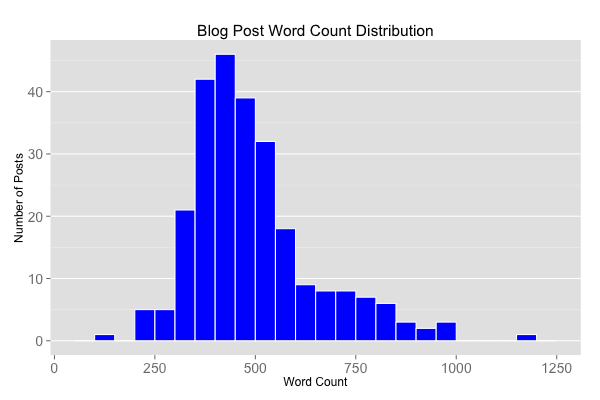
My posts vary from 100 to 1100 words, with the majority between 300 and 750 and a median of 461 words. These posts aren’t exceptionally short or exceptionally long, but I imagine they are comparable with most blogs that post near-daily. Below is the distribution of the 256 posts by word count.
Plunging into the finer points of the analysis, below is a box plot demonstrating the relationship between page views and word count. I’ve bucketed posts by keyword in 200 word increments. Note the Y-Axis is Log10. The boxes show the distributions of page views in each bucket. The middle line in each box is the median, the borders of the rectangle show the 25th and 75th quartiles and the circles are outliers. More on reading box plots.
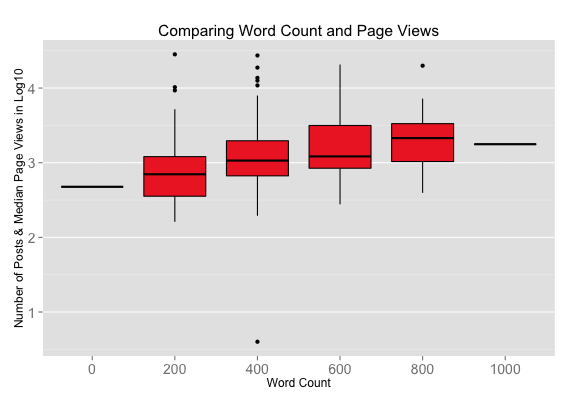
There is no difference in the traffic generated by longer or shorter posts. Though the ranges of the box plots vary, the medians are all very close to each other and while the 200 keyword bucket does seem to indicate a narrow distribution of page views, the three outliers at the top indicate the conclusion is likely a product of the smaller sample size.
In the end, the data reaffirms what I probably already knew to start. The best length for a blog post is the length required to capture and convey the message. No more, no less.