---
title: "The Acquisition Environment for Startups in 2015"
description: "Explore how $430B in tech company cash reserves will drive startup acquisitions in 2015, with detailed analysis of M\u0026A trends across B2B SaaS and key sectors."
categories: ["data analysis","exits"]
keywords: ["Theory Ventures","Tomasz Tunguz","startup acquisitions","venture capital","B2B SaaS","M\u0026A trends","tech company cash reserves","public market growth","investment strategies","mergers and acquisitions"]
ai_summary: "Explore how $430B in tech cash reserves will drive startup acquisitions in 2015, focusing on M\u0026A trends in B2B SaaS."
date: 2014-12-10
lastmod: 2026-07-21
canonical_url: https://www.tomtunguz.com/fertile-ma-market/
author: "Tomasz Tunguz"
---
Growth is king in today's public markets. Most of the SaaS IPOs we've analyzed have traded growth for profitability and they have been rewarded handsomely for it. For the large tech companies, this trend is no different. The public market prizes growth.
Some public tech companies sustain growth through internal efforts, but many use their cash reserves to acquire fast-growing startups. These public market cash reserves total $430B or so across the top 250 or so public tech companies, a massive war chest that will fuel startup M&A in 2015.
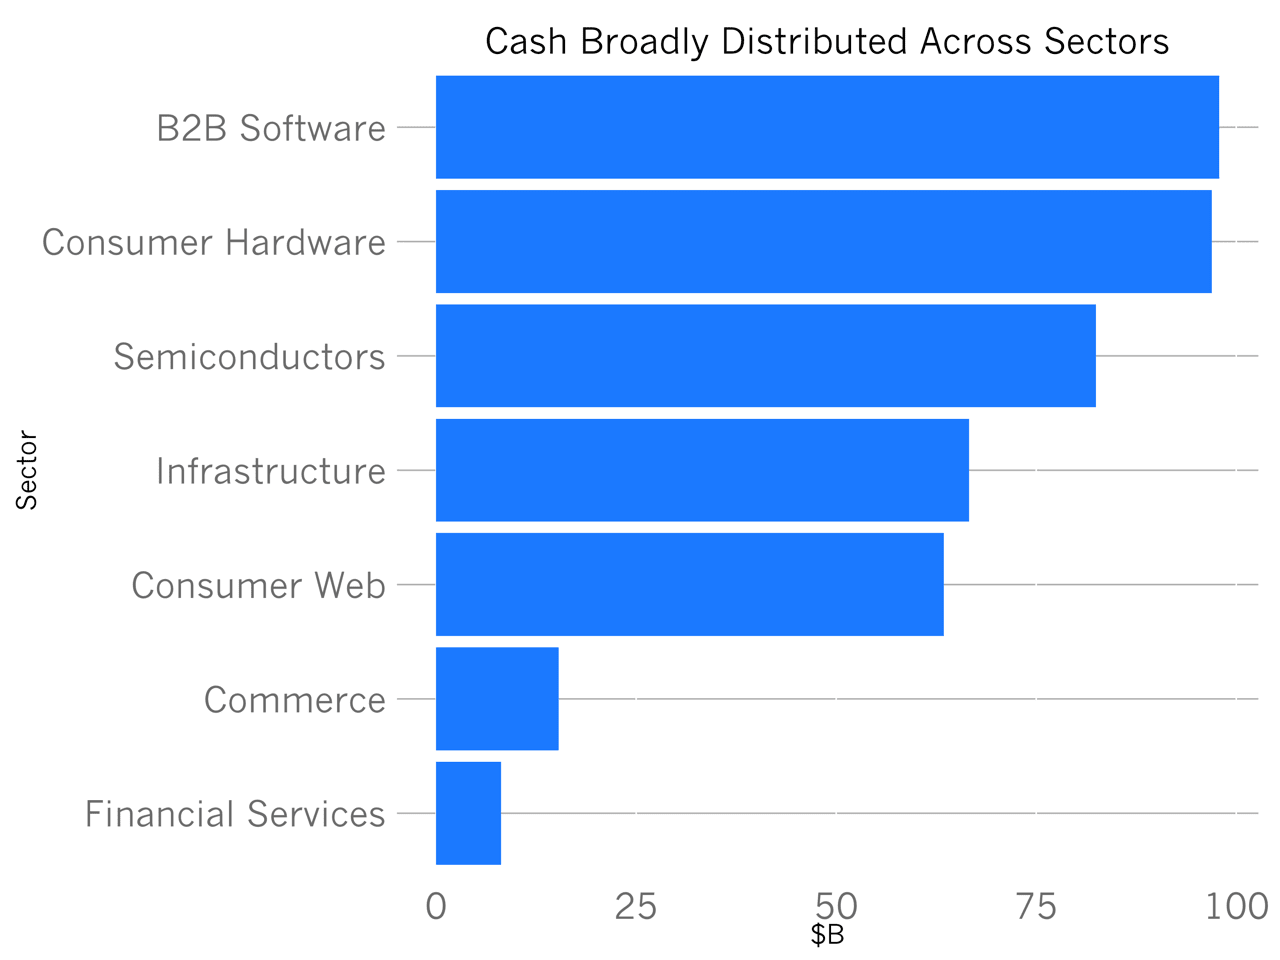
Let's break down this cash by sector: as the chart above shows, B2B software and Consumer Hardware companies each posses about $100B. Semiconductor, Infrastructure and Consumer Web companies' cash reserves total more than $65B each. In short, there's a lot of capital available across sectors.
I
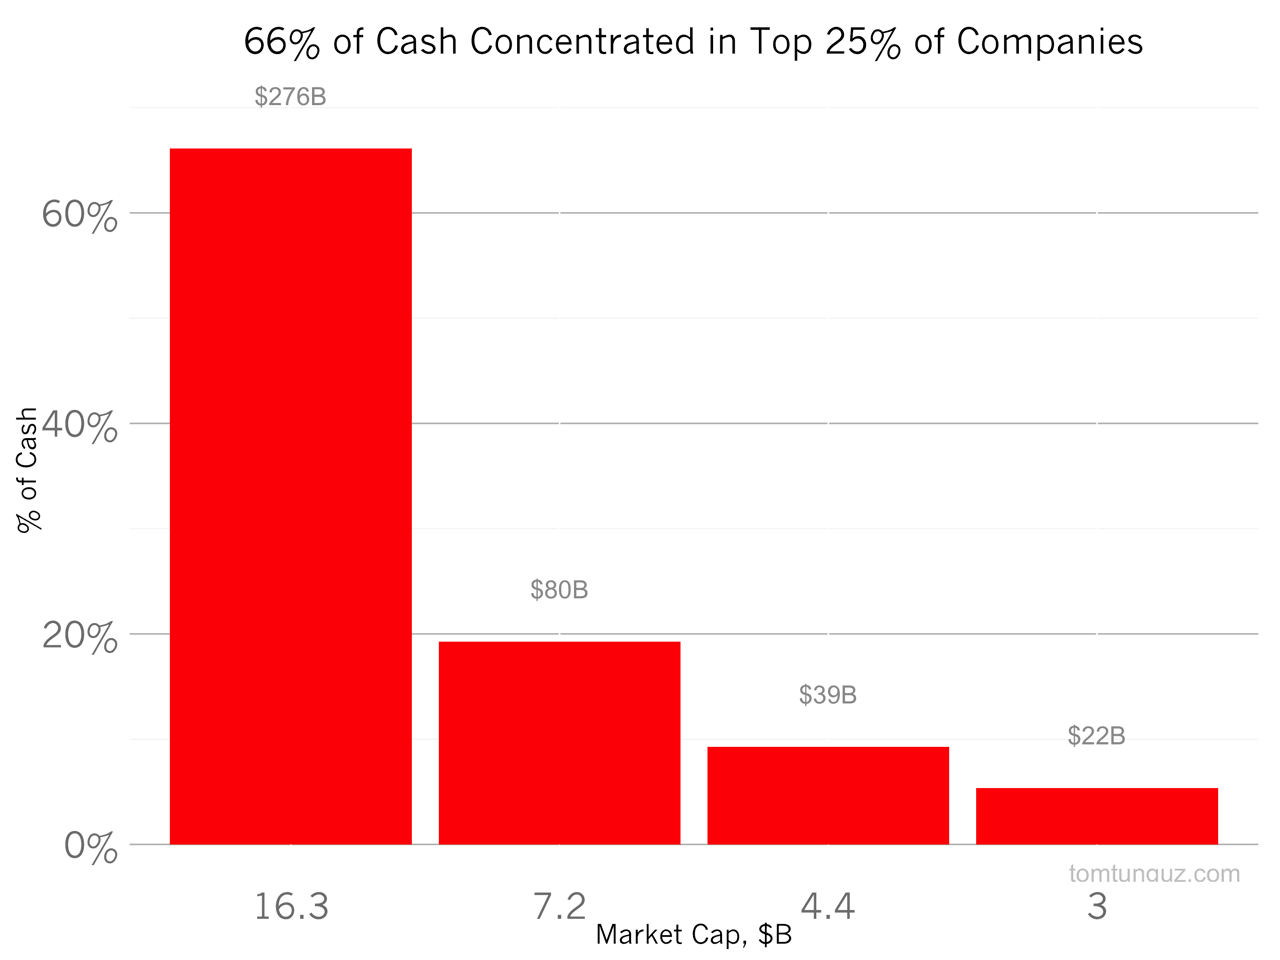
Not surprisingly, this capital isn't evenly distributed. In fact, cash follows a power law. The top 25% of tech companies by market cap control $276B or 66% of all the cash. These companies have market caps of $17.1B+. The next quartile of companies, those with market caps of greater than $7.4B and less than $17.1B control $154B or about 36%. The smallest companies in the data set control about $22B. I
Public companies use cash for many different things including share buybacks, investments in their own businesses, insurance, working capital and so on. But the sheer scale of cash on the balance sheets of IT companies, and the huge pressures from the public market for growth, indicates that there should be plenty of startup M&A activity across many sectors in 2015.