Gemini 3 Flash represents a step function increase in model deflation : a gauntlet thrown.
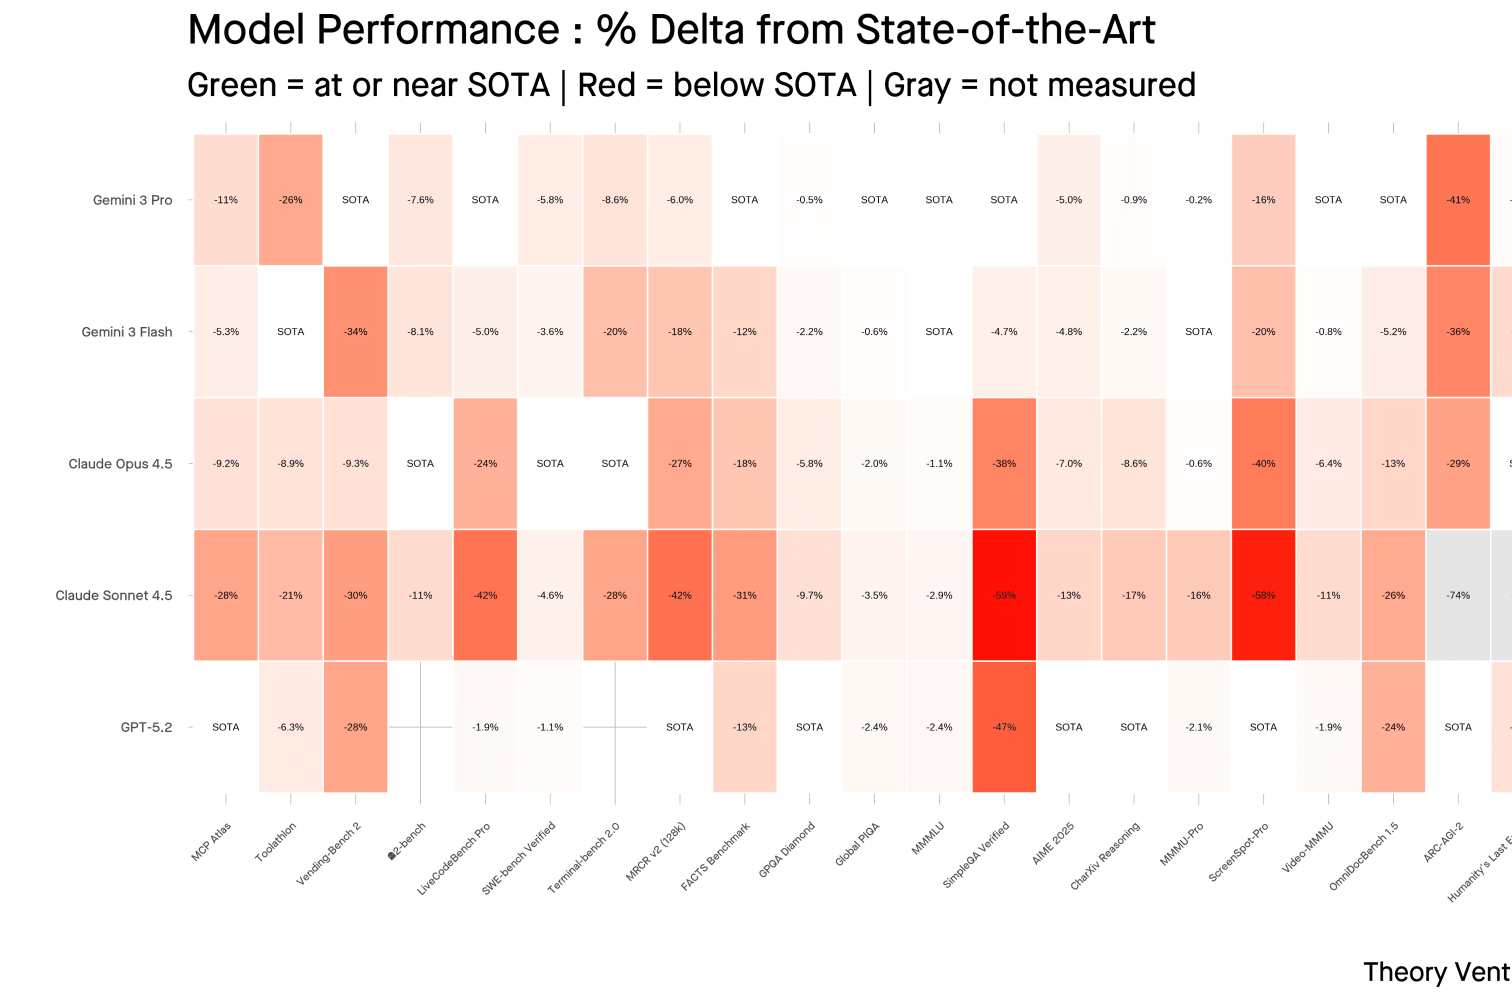
Google’s latest model underprices the state of the art by 70% to 79%, with very similar levels of performance. At $0.50 per million input tokens & $3.00 per million output tokens, Gemini 3 Flash hovers within 9% of the best scores across 20 benchmarks.1
How much better is the price-performance? How much cheaper can teams run inference?
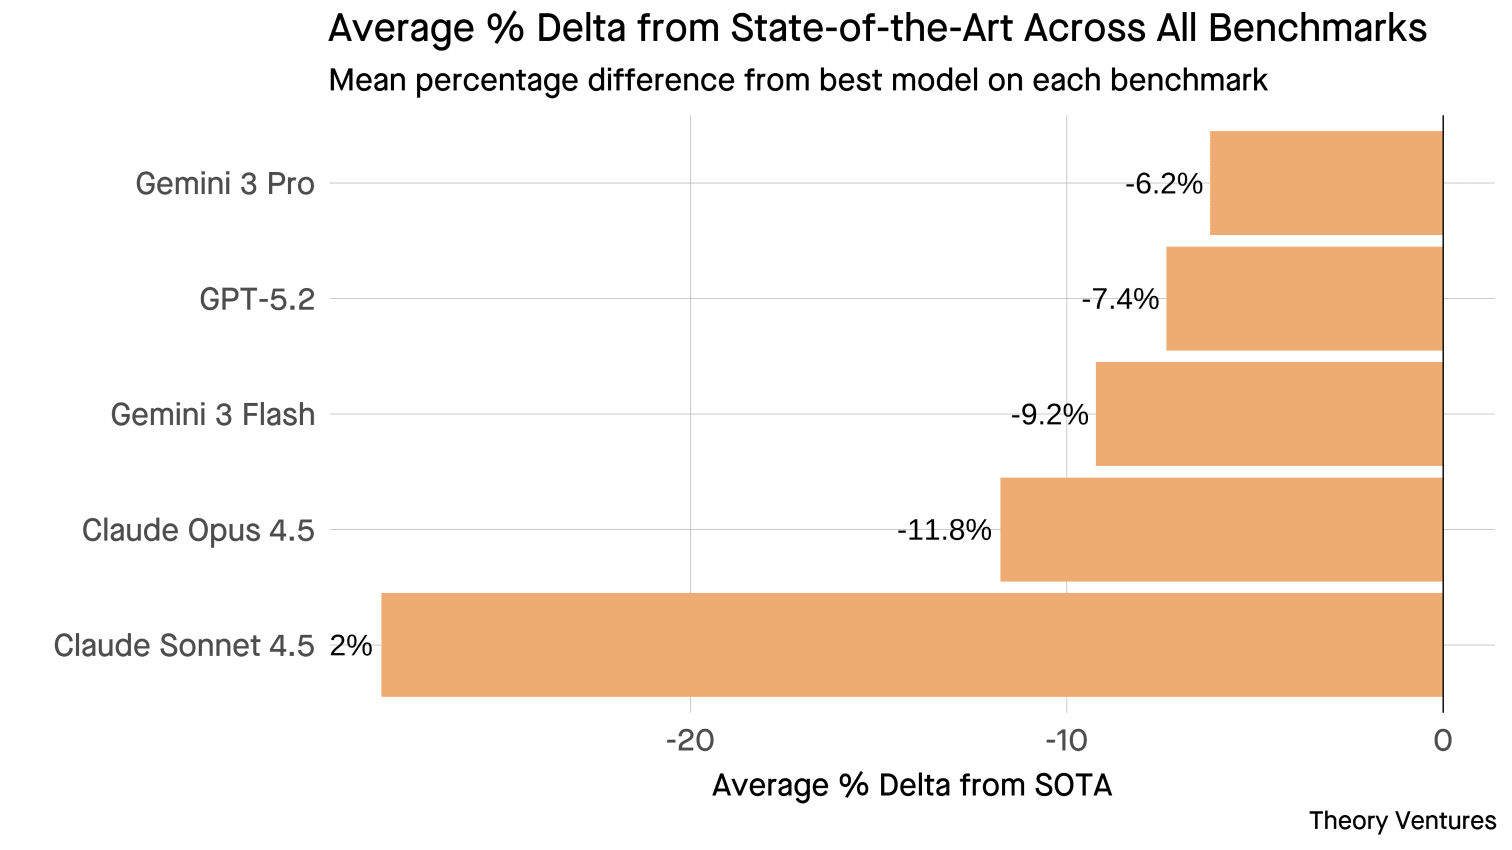
First, performance. Gemini 3 Pro tops this analysis with a 6% deviation from state of the art. Gemini 3 Flash is not far behind at 9%, followed by Opus at 12%.
Second, input price-performance. Looking at overall price-performance by input tokens reveals a huge gap. Gemini 3 Flash delivers 182 performance points per dollar compared to GPT-5.2 at 53. That’s a 3.4x advantage.
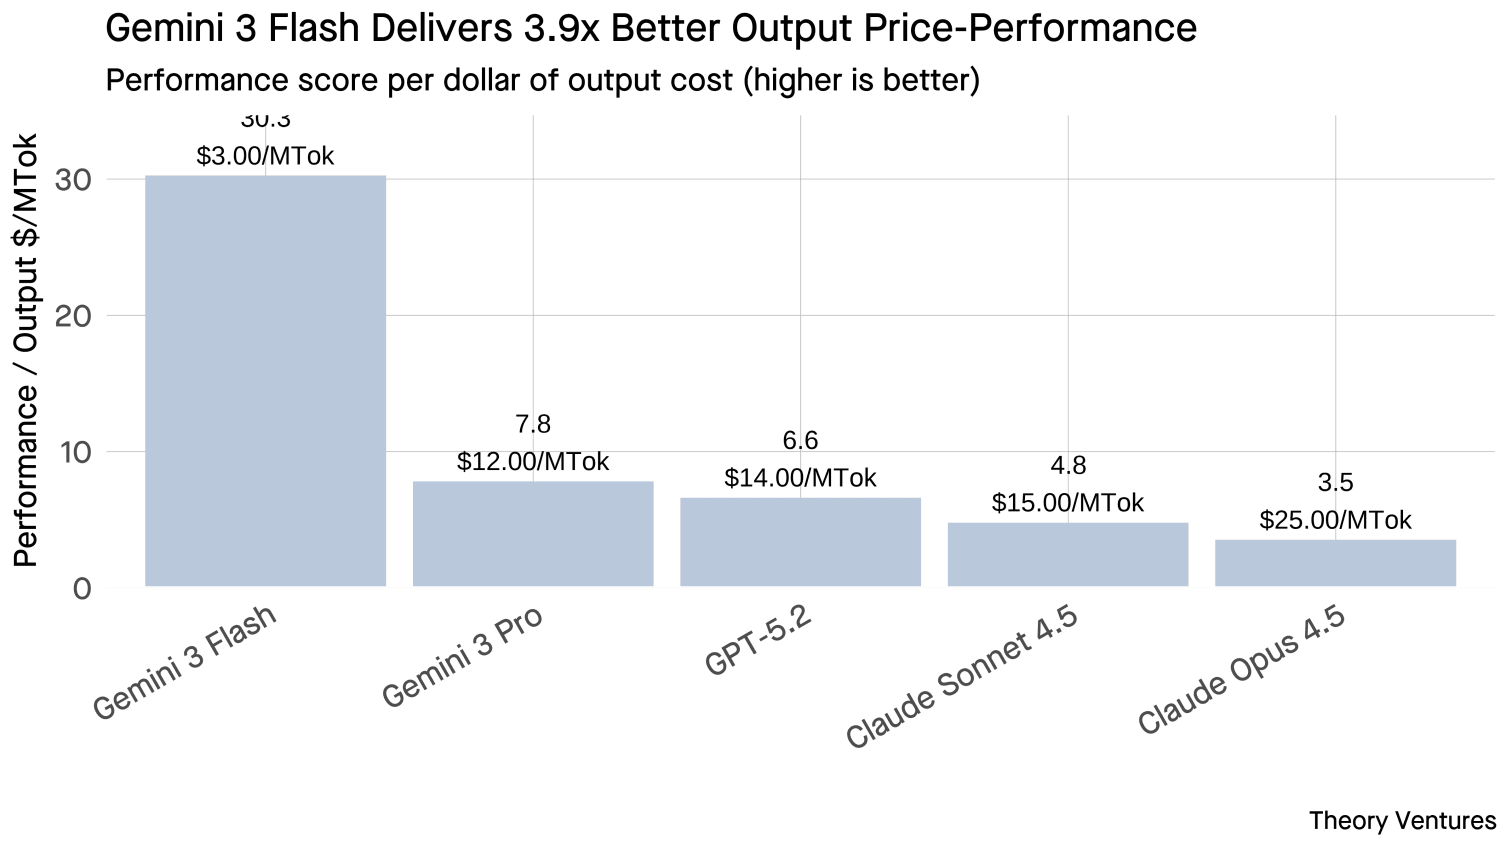
Third, output price-performance. The spread widens further. Gemini 3 Flash scores 30.3 performance points per output dollar versus Claude Opus 4.5’s 3.5 points. Claude charges $25 per million output tokens : 8x more than Gemini’s $3 : while scoring 2.9% lower on aggregate benchmarks.23
Gemini 3 Flash compresses what took $65 of GPT-4 tokens in March 2023 into $1.10 today for equivalent capability.4 That’s 98% deflation in 33 months. For teams building AI products, this isn’t incremental improvement : it’s a category shift that makes previously uneconomic use cases viable.
| Model | Performance Score | Avg % From SOTA | Input $/MTok | Output $/MTok |
|---|---|---|---|---|
| Gemini 3 Flash | 90.8 | -9.2% | $0.50 | $3.00 |
| GPT-5.2 | 92.6 | -7.4% | $1.75 | $14.00 |
| Gemini 3 Pro | 93.8 | -6.2% | $2.00 | $12.00 |
| Claude Sonnet 4.5 | 71.8 | -28.2% | $3.00 | $15.00 |
| Claude Opus 4.5 | 88.2 | -11.8% | $5.00 | $25.00 |
The pace of model releases in Q3 & Q4 has been relentless. The performance improvements have shattered expectations. What’s even more unbelievable : a 70% to 80% discount on that performance within weeks of release.
Google is leading the deflation in AI pricing, selling tremendous performance at going-out-of-business prices.
State of the art (SOTA) : the best score achieved by any model on a given benchmark, used as the 100% baseline. Performance score = 100 + average percentage delta from SOTA.
-
Methodology : Measuring overall price-performance is hard. I used a heuristic : percentage delta from state of the art across 20 different benchmarks, run across the five most recent frontier models (Gemini 3 Flash, Gemini 3 Pro, GPT-5.2, Claude Opus 4.5, Claude Sonnet 4.5). Each model’s score on each benchmark is compared to the best score achieved by any model on that benchmark. The percentage delta is then averaged across all benchmarks to produce a composite performance score. ↩︎
-
Claude Opus 4.5 output pricing ($25/MTok) divided by Gemini 3 Flash output pricing ($3/MTok) = 8.3x. Performance score difference : Gemini 3 Flash (90.8) - Claude Opus 4.5 (88.2) = 2.6 points, or 2.9% lower relative to Gemini 3 Flash. ↩︎
-
Correction (Dec 17, 2025) : Updated “2.6% lower” to “2.9% lower” to reflect the correct percentage calculation (2.6 points / 90.8 = 2.86%). ↩︎
-
Cost per unit of performance calculated as blended token price (80% input + 20% output) divided by composite benchmark score. GPT-4 (March 2023) : $36 blended / 0.55 composite = $65.45. Gemini 3 Flash (Dec 2025) : $1.00 blended / 0.908 composite = $1.10. Deflation : ($65.45 - $1.10) / $65.45 = 98.3%. ↩︎