Google Cloud grew 82% year-over-year to $24.8b in Q2 2026, beating the $22.3b consensus. The number alone would headline any earnings report. The more important signal is what it converges toward: Google Cloud’s growth rate now mirrors NVIDIA’s.

Google did start selling hardware this quarter. CFO Anat Ashkenazi told investors Google “began to recognize revenues from TPU system sales, which we delivered to customer data centers for the first time in Q2.”1 But she was clear the dollars were small: cloud growth “accelerated meaningfully even after excluding the impact of TPU system sales,” with the bulk of TPU revenue landing in 2027. The convergence has a different source. Google Cloud rents AI compute by the hour, NVIDIA sells the chips outright, & both revenue lines are downstream of the same demand to train & run AI models.
The chart shows the convergence. Google Cloud & NVIDIA’s Data Center segment now trace the same curve, one bending up on rental revenue, the other on unit sales, NVIDIA ahead on scale.

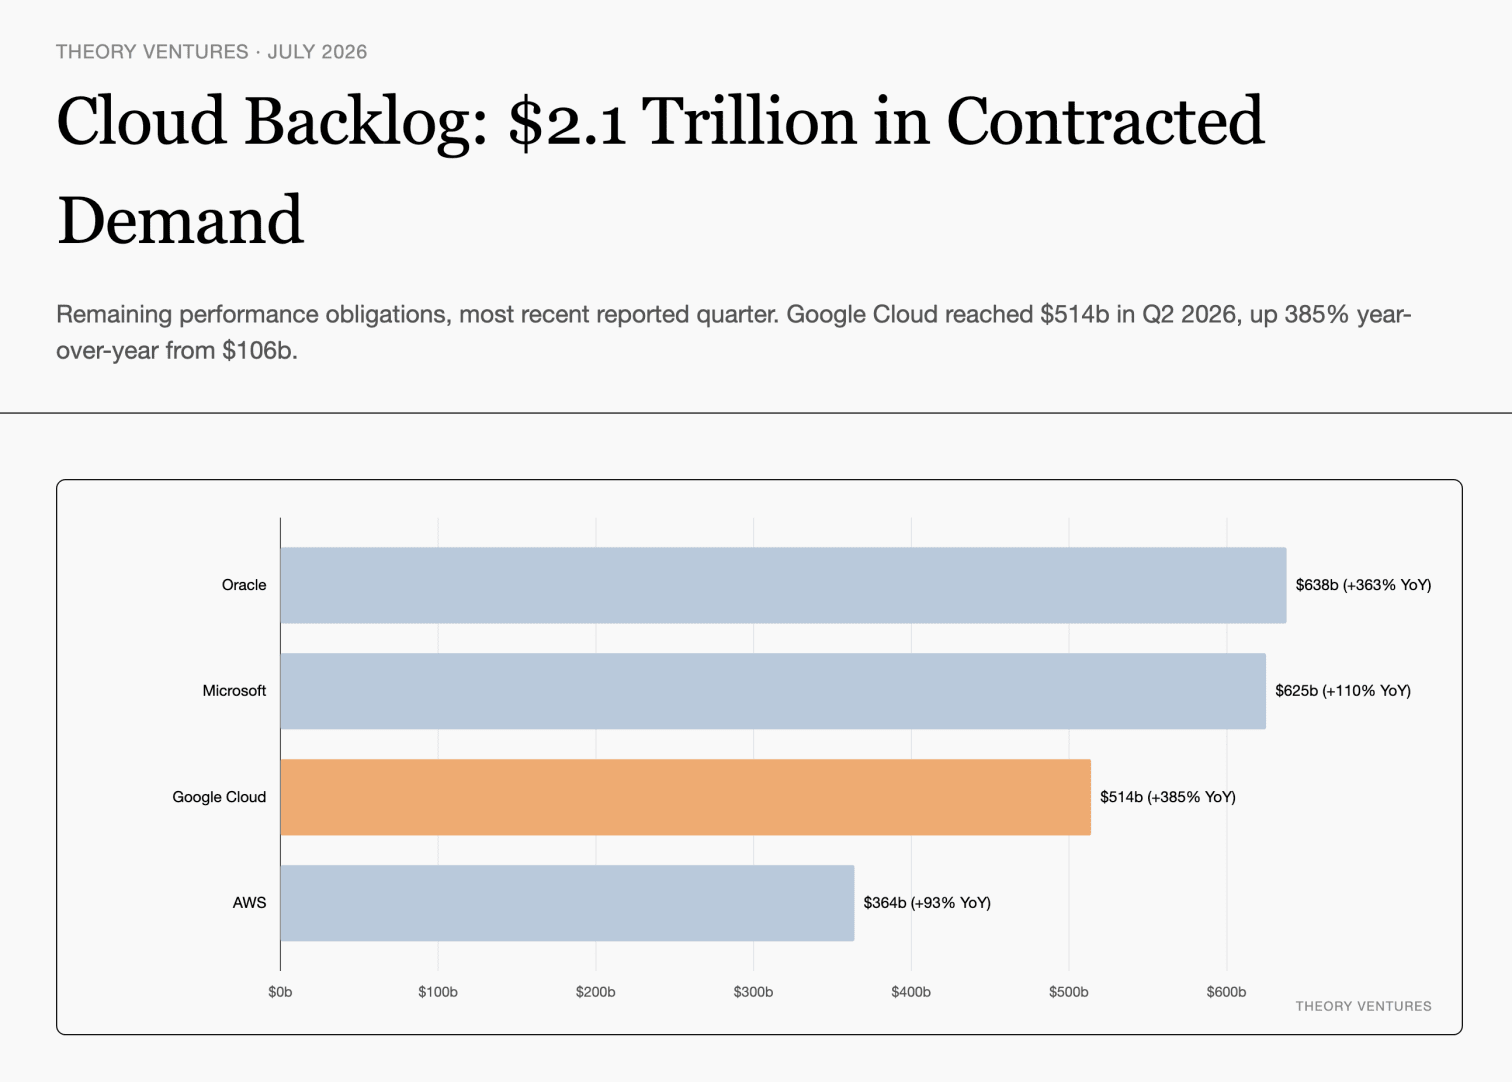
The pipeline points the same direction. Google Cloud’s backlog reached $514b, up 385% from $106b a year ago & up more than $50b in a single quarter, with just over half set to convert to revenue within 24 months. Set against the other hyperscalers, the four largest cloud providers now carry more than $2t in contracted demand.
Plus, Google enjoys economies of scale. Cloud operating income was $8.8b, more than tripling year-over-year, & operating margin expanded from 20.7% a year ago to 35.6%.
Set against AWS, the margin gap is closing fast.
| Segment | Operating income | Revenue | Operating margin | Margin change YoY |
|---|---|---|---|---|
| AWS | $14.2b | $37.6b | 37.7% | -1.8 pts |
| Google Cloud | $8.8b | $24.8b | 35.6% | +14.9 pts |
The timing differs: AWS has not yet reported calendar Q2 2026, so its figures are Q1 2026, while Google Cloud’s are Q2 2026. AWS remains larger in absolute dollars, but its margin slipped nearly two points year-over-year while Google Cloud’s expanded almost fifteen, narrowing a gap that was 19 points a year ago to barely two.
The ROI on capital investment is clear, so more capex is projected. Google raised full-year 2026 capex guidance to $195b to $205b, up from $180b to $190b, & said it expects capex “to increase significantly in 2027.” Across Amazon, Microsoft, Meta, & Oracle, industry AI infrastructure spend is on a path well beyond $1t next year.
We’ve never seen businesses at scale grow this fast & this profitably.
-
Alphabet Q2 2026 earnings call, July 22, 2026. All quoted figures & remarks from the transcript. Framing first flagged by SemiAnalysis (@SemiAnalysis_). ↩︎