---
title: "How Quickly Does a SaaS Startup Have to Grow to Go Public?"
description: "Discover the revenue milestones SaaS startups need to hit for IPO success. Data from 41 public companies shows median path from $11M to $100M+ revenue."
categories: ["SaaS","fundraising"]
keywords: ["SaaS growth","IPO milestones","Theory Ventures","Tomasz Tunguz","venture capital","public companies","revenue growth","profitability metrics"]
ai_summary: "Explore the revenue milestones and growth rates SaaS startups must achieve to successfully go public."
date: 2014-03-13
lastmod: 2026-07-30
canonical_url: https://www.tomtunguz.com/growth-rates-of-public-saas-companies/
author: "Tomasz Tunguz"
---
At the time of the IPO, the median Software-as-a-Service (SaaS) company generates $100M in revenue, creates $2.6M in profit and holds $85M in cash on the balance sheet. A company in this position typically raises $107M in its IPO and trades at 11x revenue, for a $1.1B market cap.
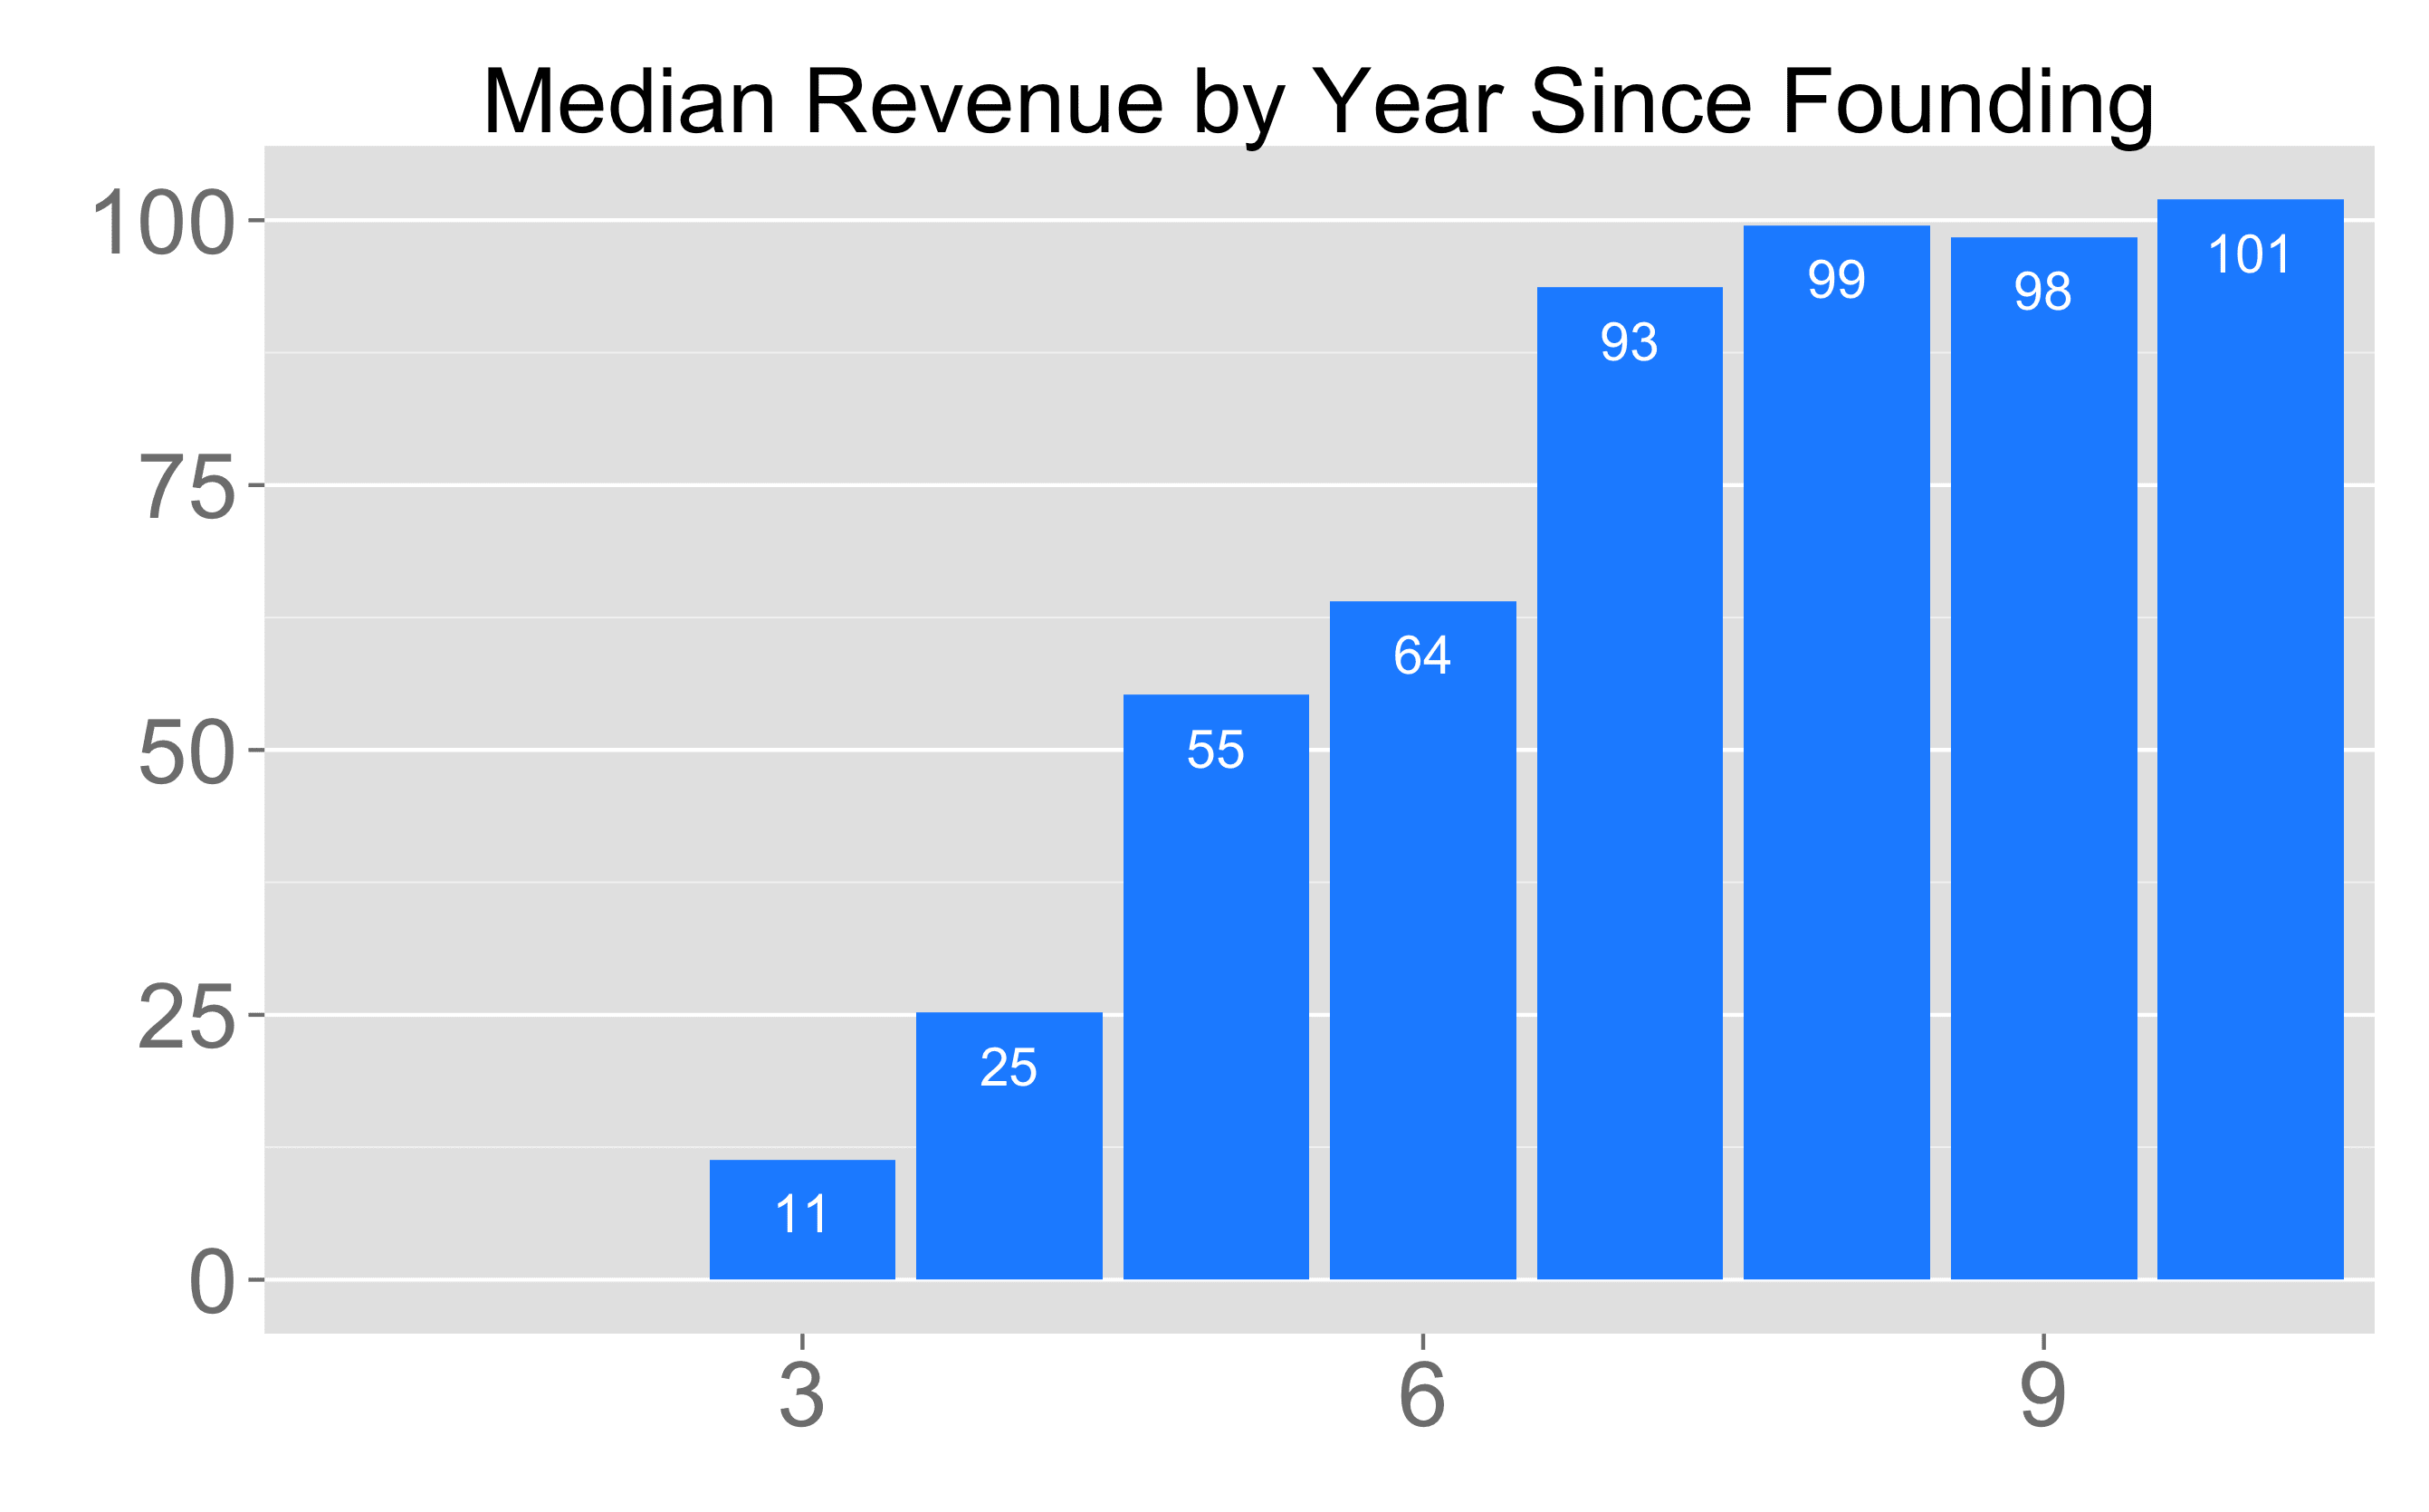
The path to getting there is revealing. Below is a chart showing the median revenue ramp of the 41 publicly traded SaaS companies by year since founding. In year 3, the median revenue is $11M. In year 4, the revenue figures more than double to $25M, and then again to $55M.
Note, the $11M number in year 3 is somewhat skewed by extraordinarily fast-growing companies. I've used data from public filings in this analysis and of the 20 companies profiled with data available in this time frame, only 5 of them (Veeva, Marin, LogMeIn, SuccessFactors, and DealerTrack), grew fast enough to IPO within a time period that would have forced them to disclose their year 3 revenues. By year four, the sample size doubles to nine. To see the trend in greater detail, [click here](https://res.cloudinary.com/dzawgnnlr/image/upload/q_auto/f_auto/w_auto/sample_size.png ).
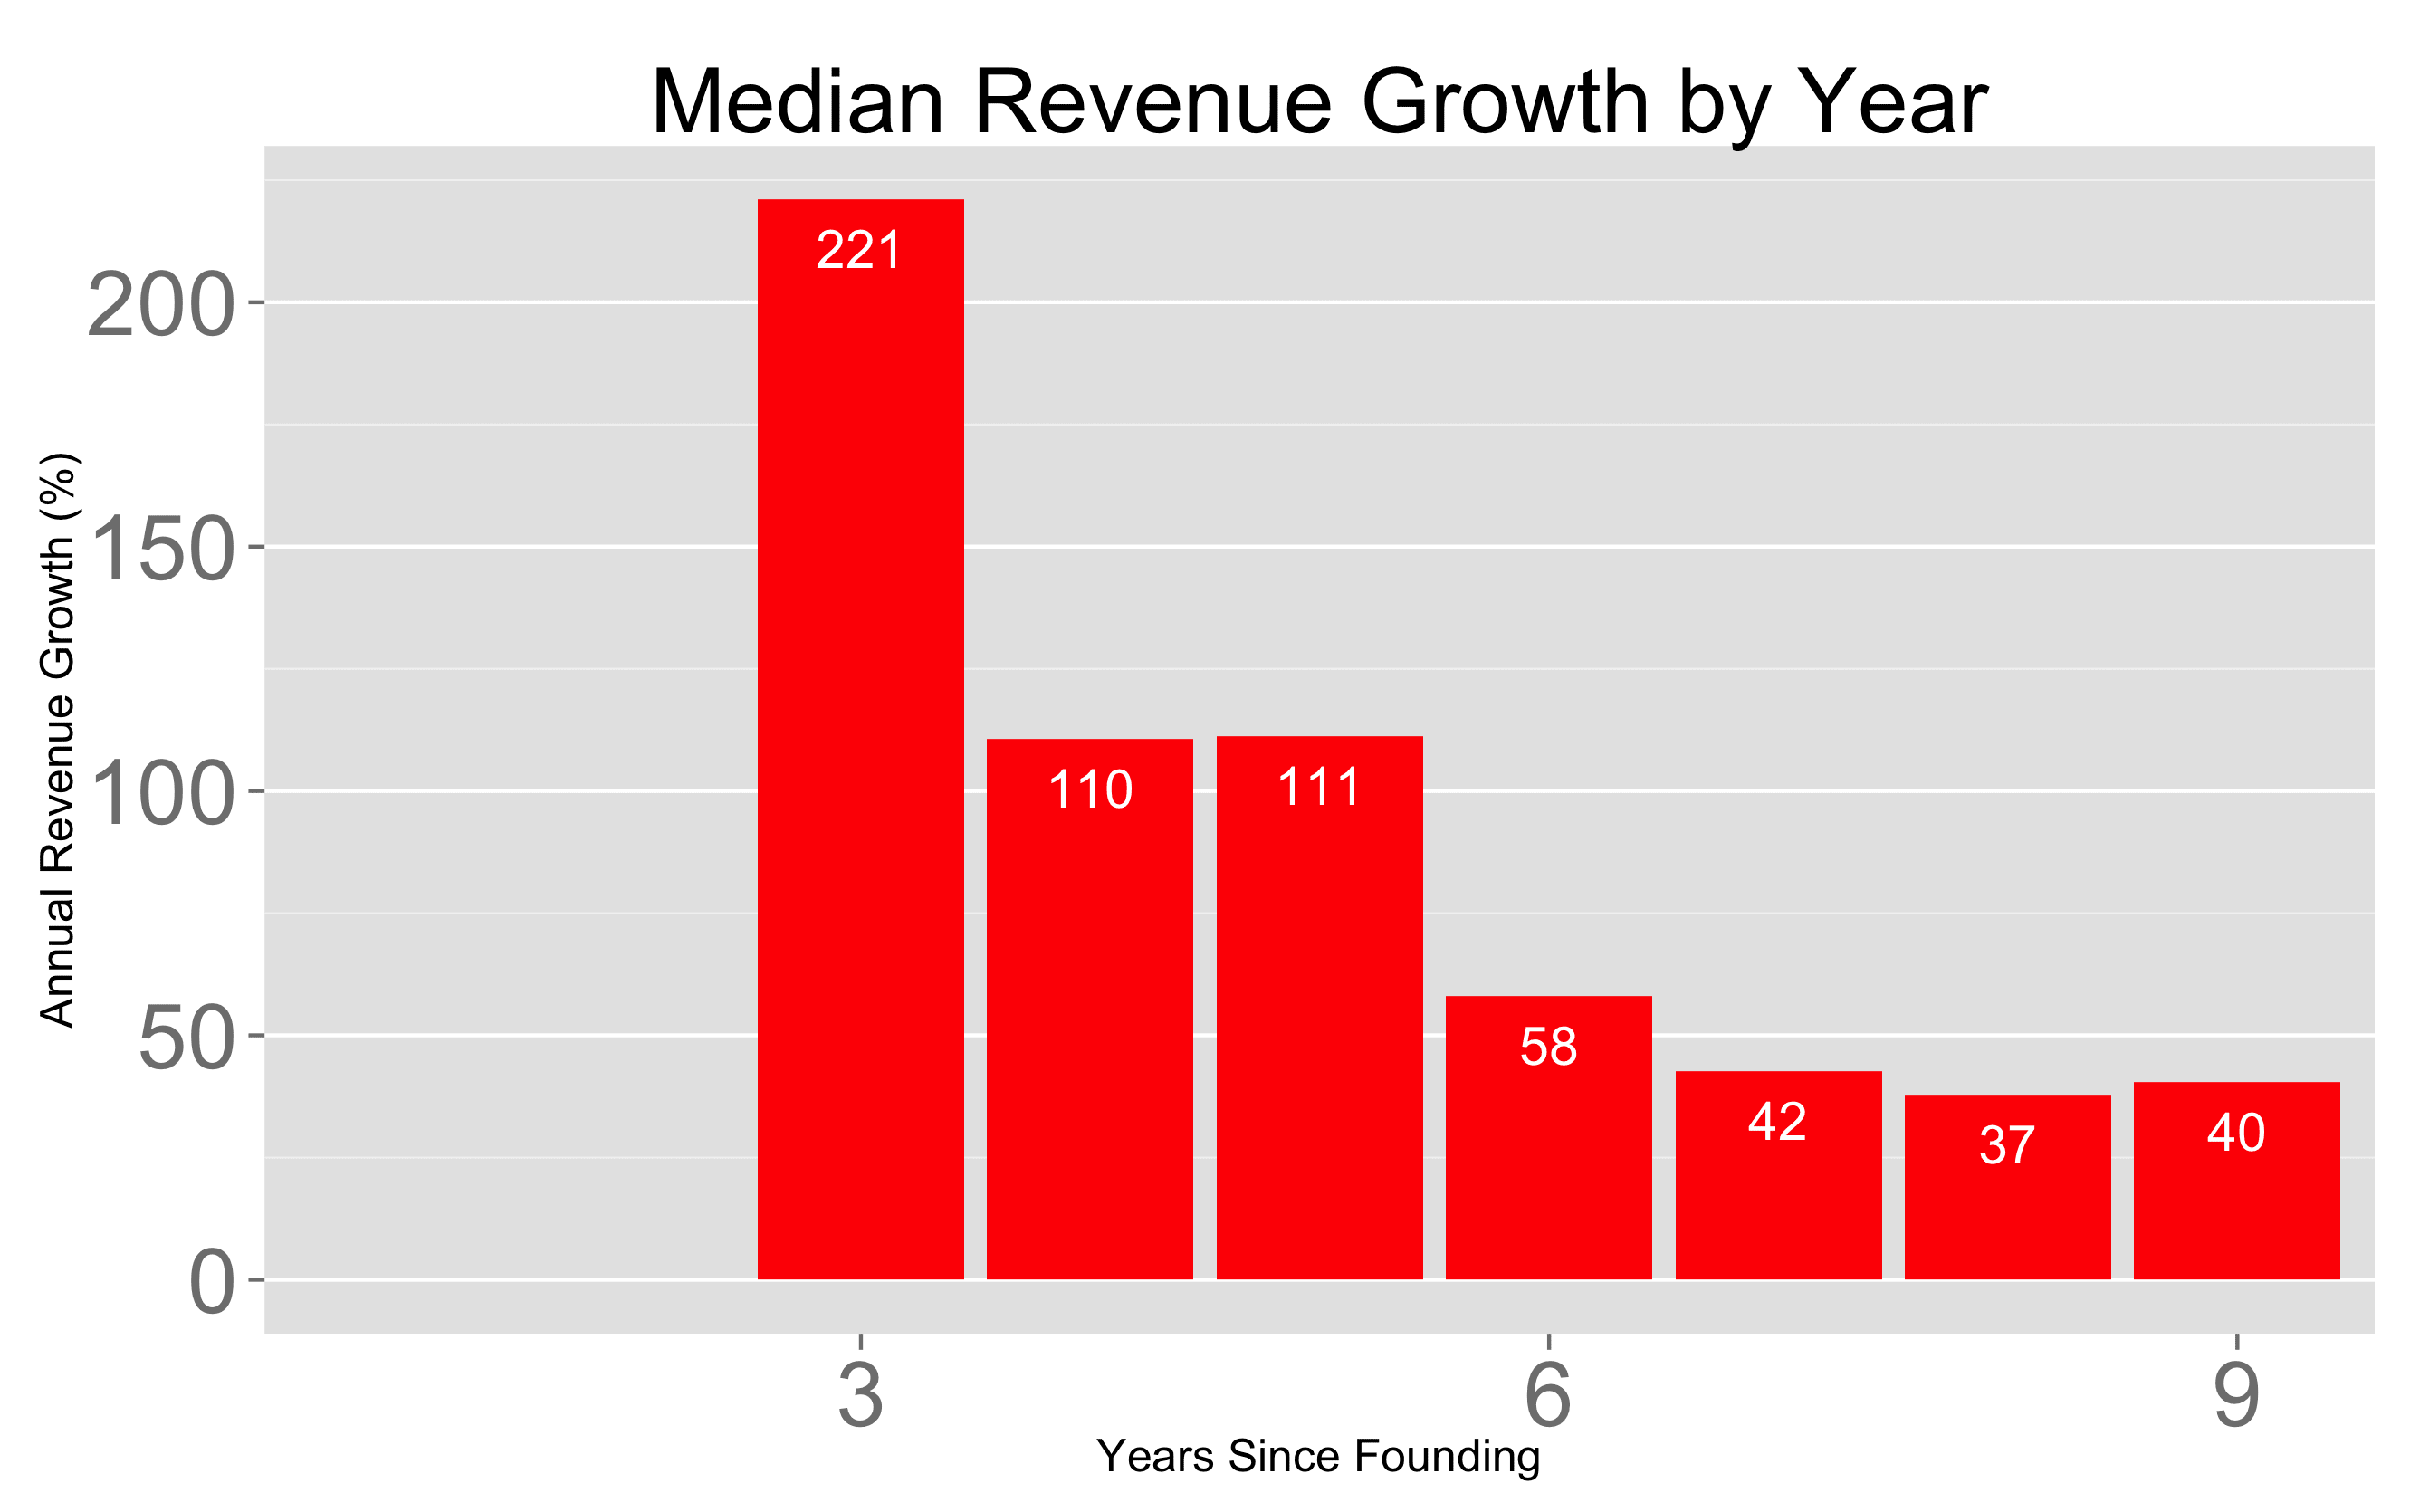
This chart shows the median growth rates of public SaaS companies by year since founding. 220% growth in year 3, and then about 110% growth for the next two years, and then halving once more for the next four years.
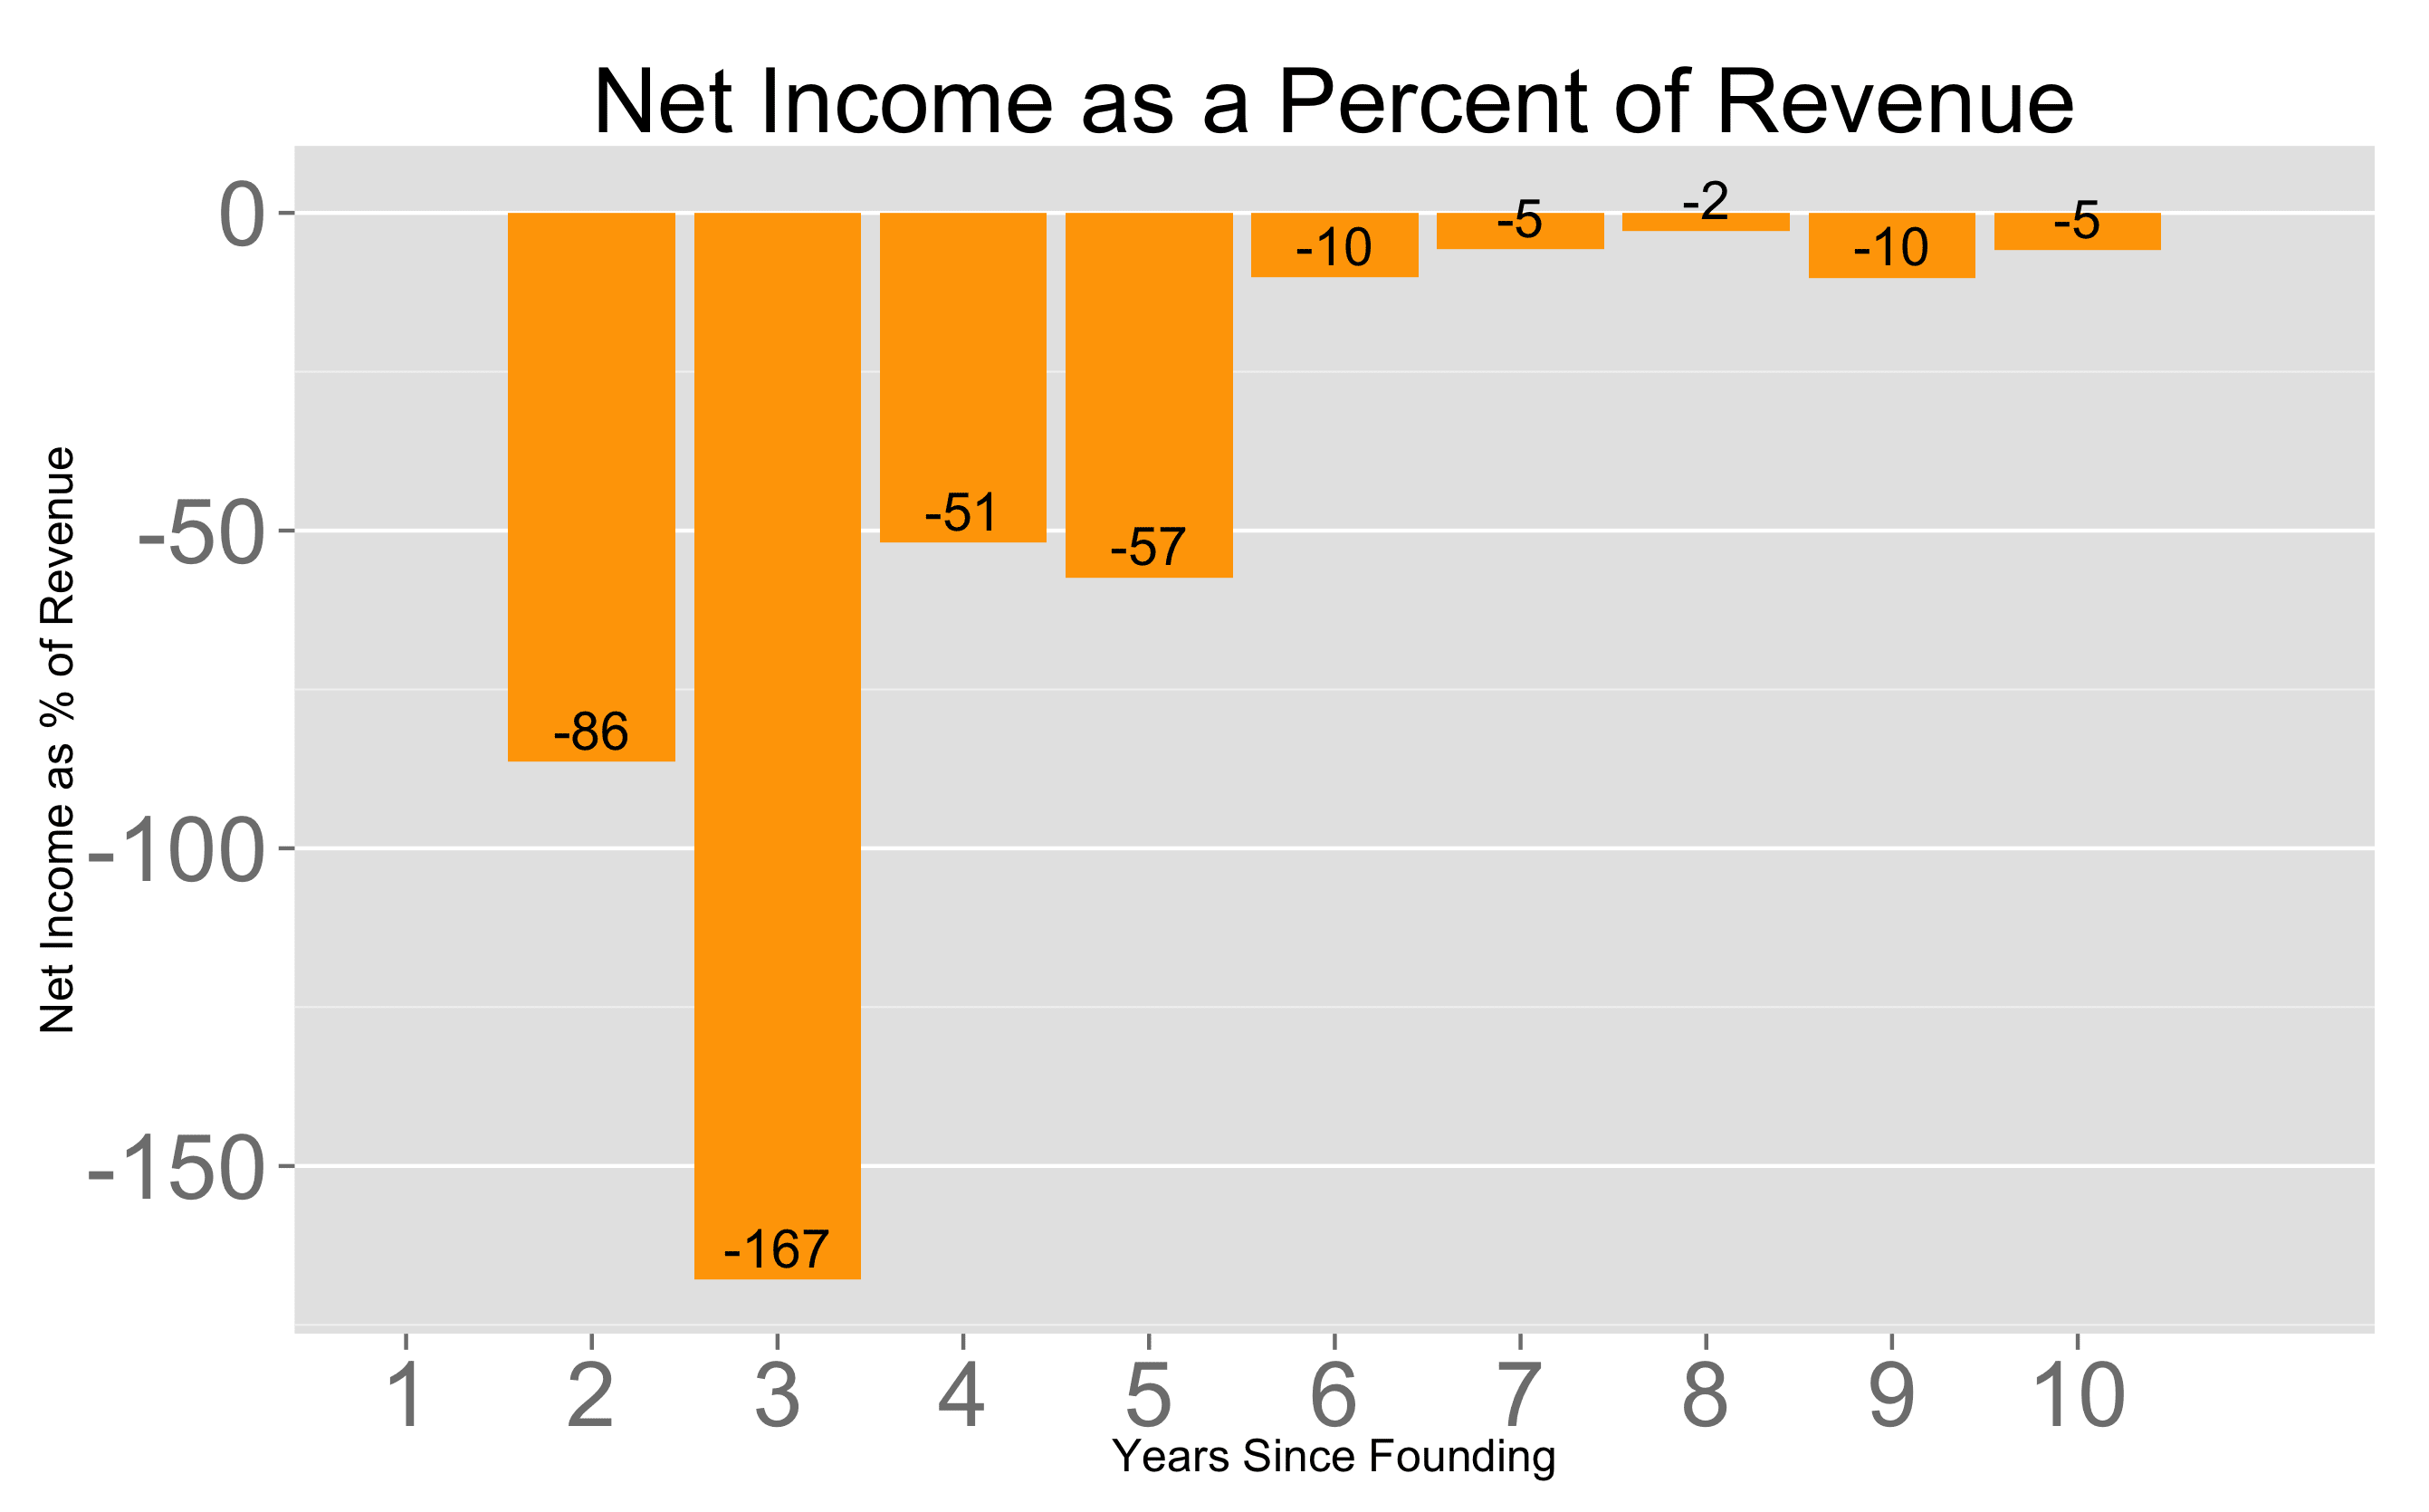
As for profitability, the public SaaS companies in the data set spent 86% of revenue in Year 2, and 167% of revenue in year 3 before falling to the mid-fifties and reaching near-profitability in year 6.
Of course, there is a substantial variance hidden within these summary statistics. For example, about 1/3 of the companies in the data set waited more than ten years to file their S-1s. Two waited 18 years. But the figures do provide a rough sense of the magnitude of revenue and the pace of growth needed to take a SaaS company public.