In my recent post about the fundraising market during COVID, I wondered aloud about inside rounds. Inside rounds, new financing rounds led by existing investors, have historically been primarily the territory of companies who cannot raise from outside investors at attractive terms. But recently, insiders have been leading the most competitive rounds in their portfolio companies. Or at least, that was my perception.
What does the data say?
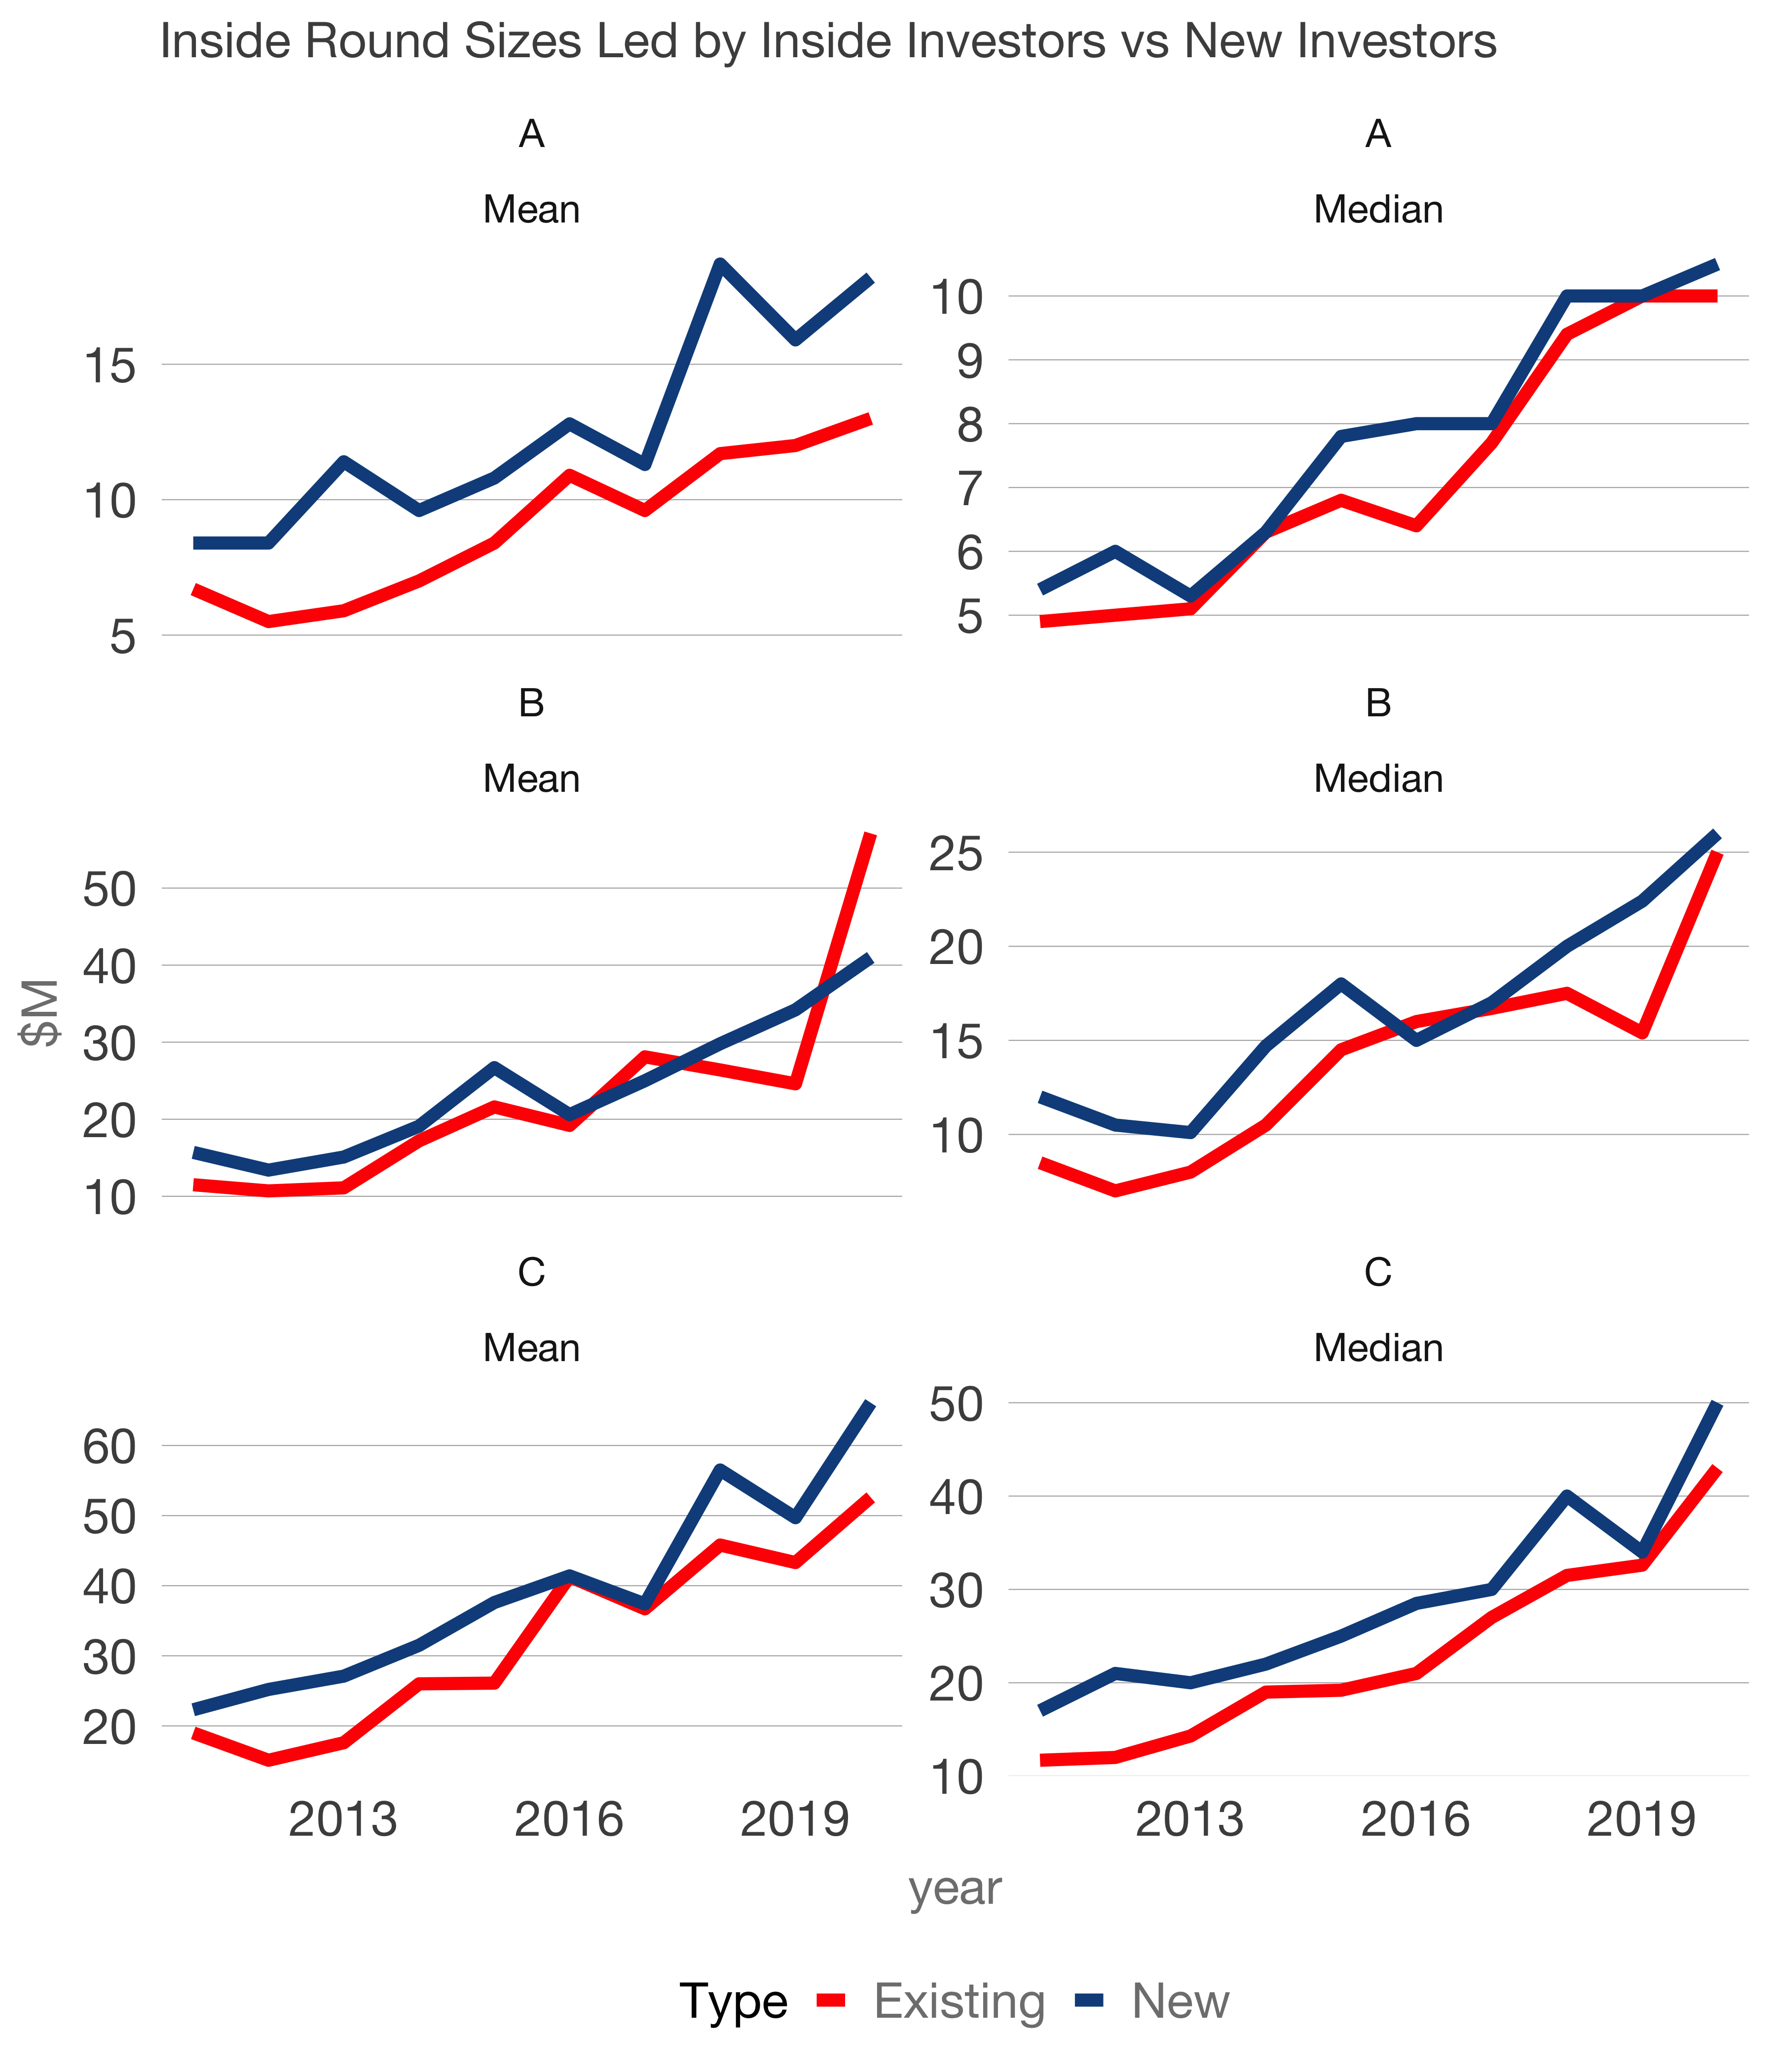
This is a collection of six charts. Each row shows the mean and the median round size for US startups over the last 10 years. Each chart shows the difference in round size led by existing investors in red and new investors in blue.
One note before we go step-by-step through the charts. We should expect mean/average round size to be higher than medians. Round sizes skew left. There are many more small rounds than large rounds for a given series. But the large rounds are enough to pull, aka skew, the mean higher than the median to the right (higher).
Series A means haven’t changed much. There is a relatively consistent premium to outside rounds led by new investors over inside rounds. The medians are roughly the same over the decade. Again, this has to do with the skew. We would expect this pattern if insiders were not aggressive about leading inside rounds in the most attractive companies.
The Series C market has evolved in parallel to the Series A market. Patterns haven’t changed.
However, Series B data suggest insiders are leading aggressive rounds into compelling businesses. Witness the red line in this Series B Mean chart. Inside rounds have skyrocketed. Last year, inside rounds were 28% smaller than outside rounds. In 2020, they are 40% larger, a $33M swing in round size.
We can argue the inside Series Bs have increased in size annually and are larger than outside rounds with very high confidence. The difference in means between inside and outside has a p-value of 0.095. And the annual change of inside Series Bs has a p-value of 0.009.
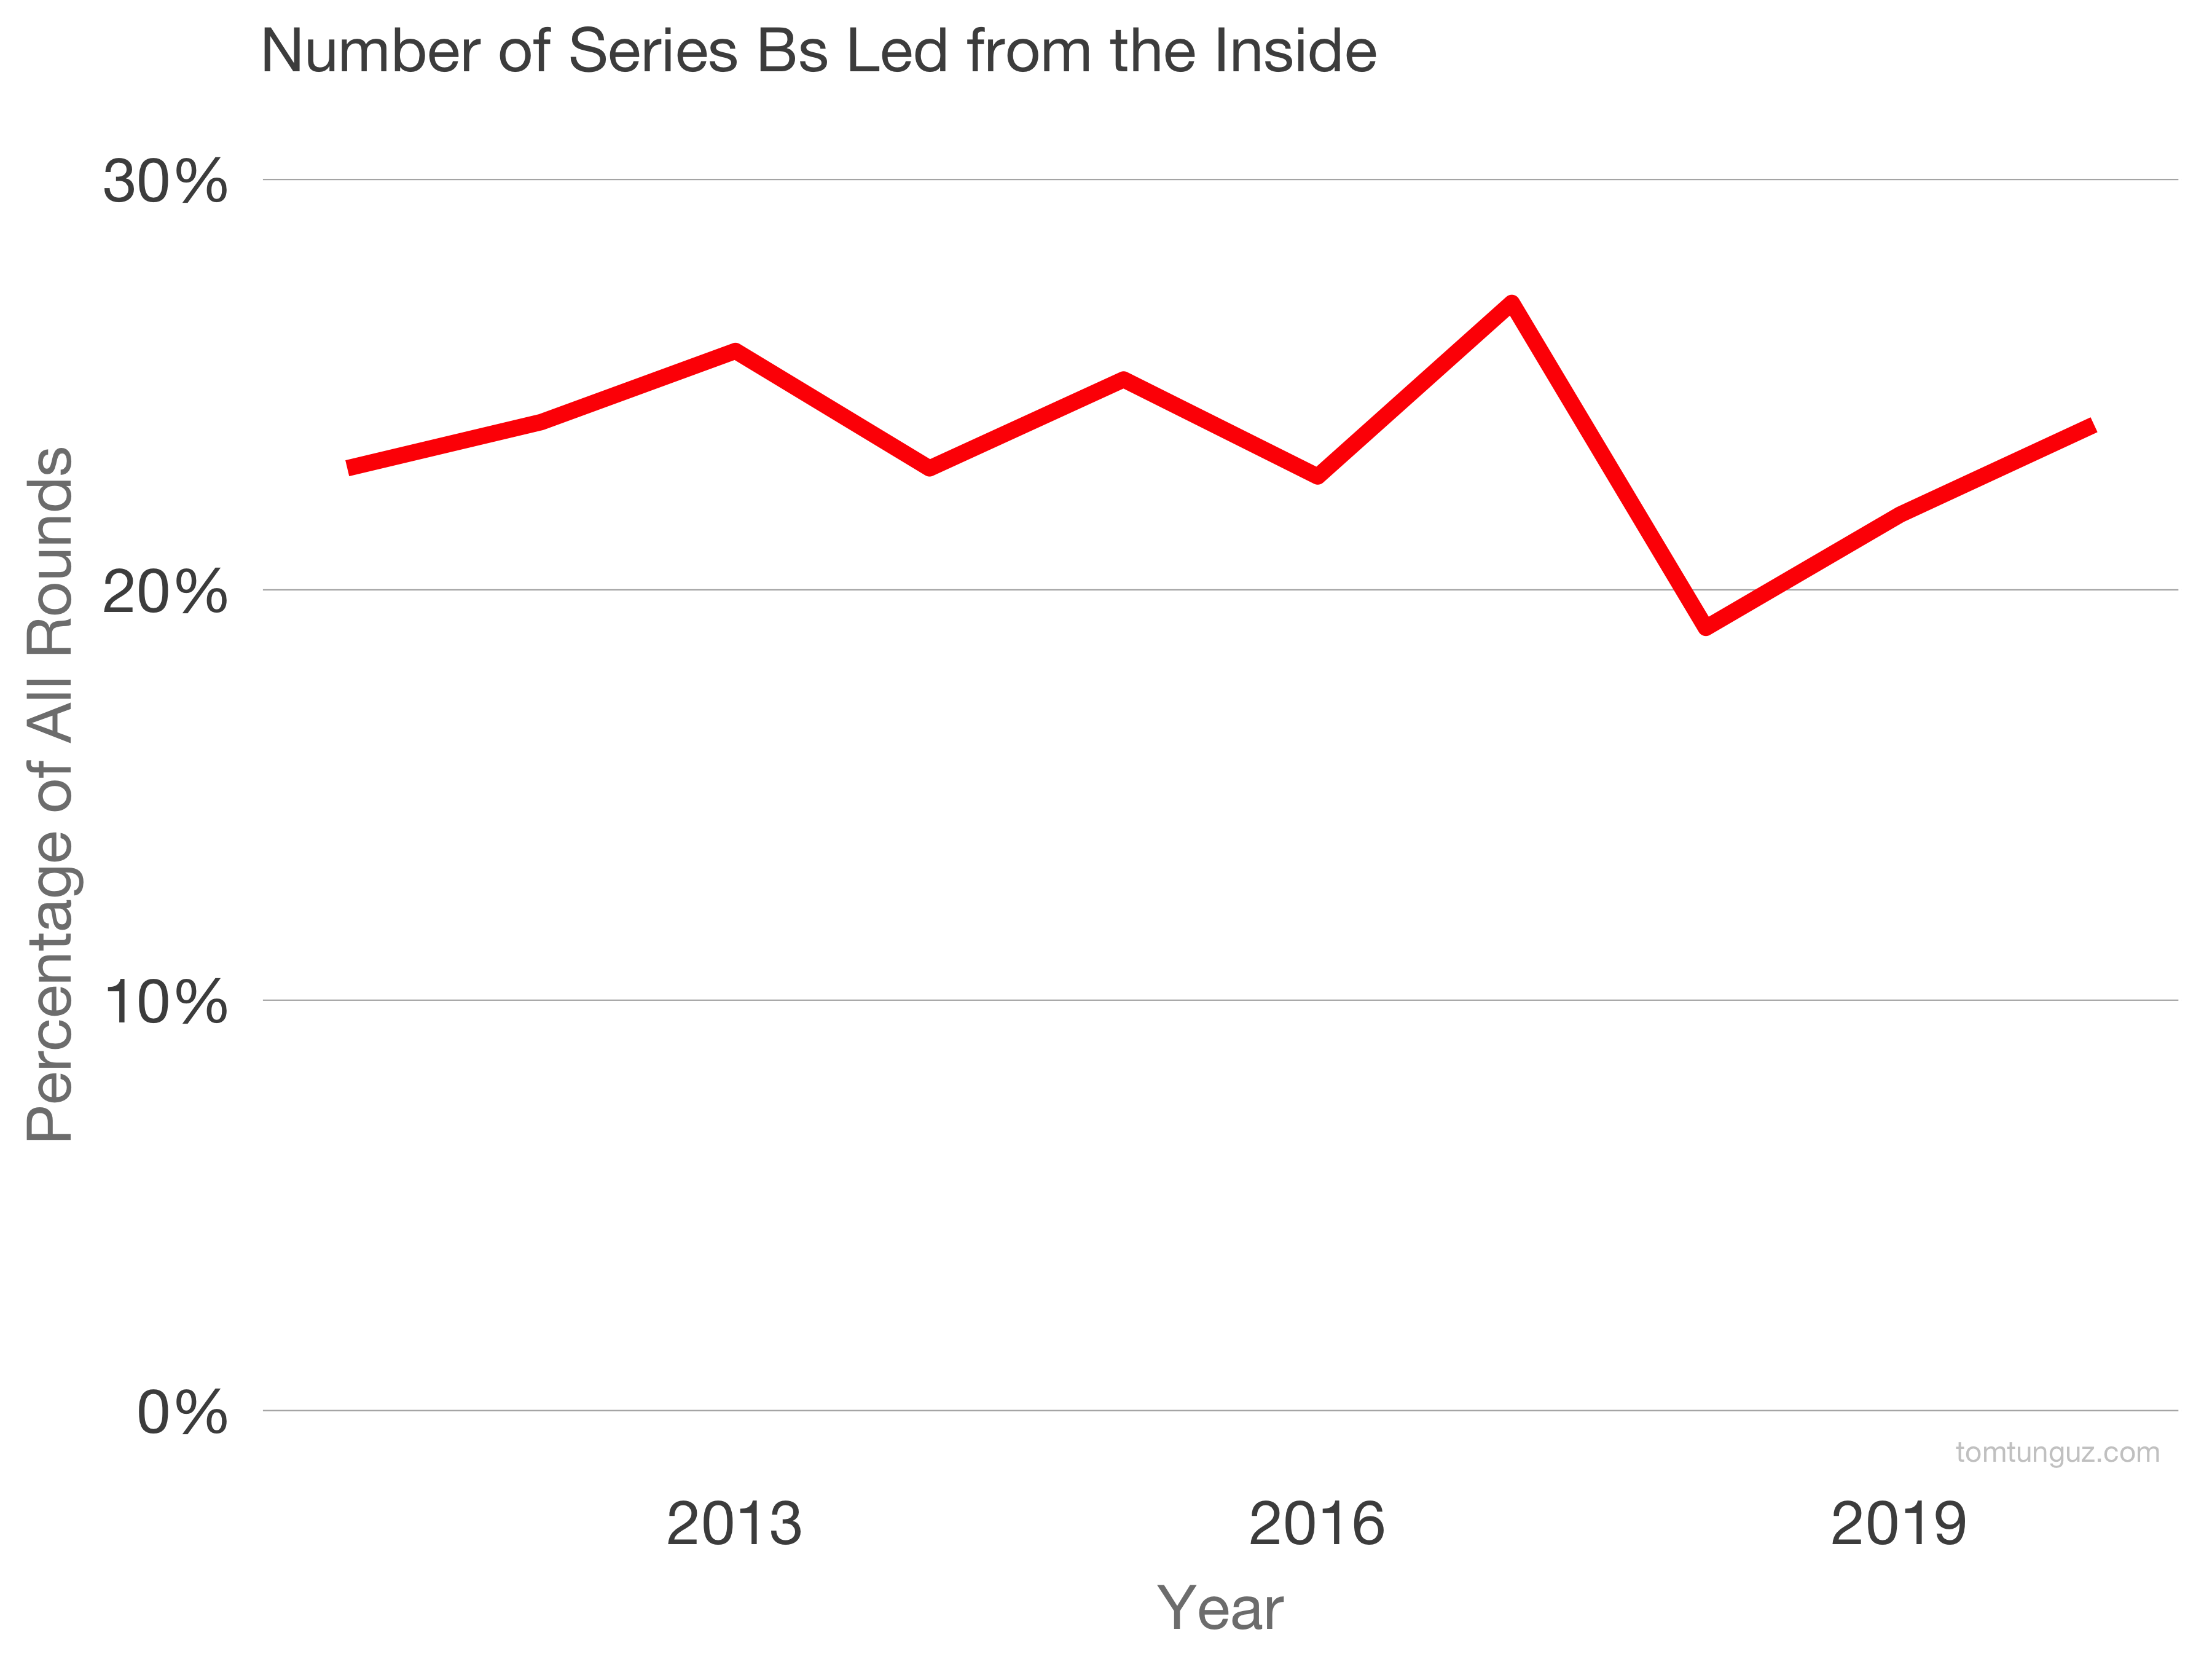
Interestingly, the share of inside Series B rounds hasn’t changed. It has hovered around 22-23% for the past decade.
What does this tell us? In 2020, Series A investors have changed their behavior at the Series B. We can see in the data Series A investors are pre-empting rounds at lofty valuations with massive checks.
As I wrote in the previous post, this is happening because investors are adjusting to a virtual environment. Diligence completed almost entirely over video is new. If you trust a team, if you understand a company well, if you enjoy information asymmetry from a board seat, and if you’re less comfortable with remote diligence, pre-empting the Series B is very rational. Especially with so many early-stage funds raising opportunity funds and LPs seeking direct co-investments.
Curiously, we don’t observe similar patterns in Series C rounds. It may be because there aren’t enough funds structured to lead the C after leading the B. Or it may be because the companies are more established, have more metrics to show, trade on multiples, and there’s more competition for them. It may be because founders seek variety in board composition and capital table ownership. Last, it may be that these rounds are happening but aren’t appearing in the data. I’m guessing here.
Regardless, inside Series Bs have swelled after COVID. Founders benefit from faster investment processes, larger rounds, and the same friendly face mooning at them over Zoom.
Data source: Crunchbase; a big thanks to the team there for helping me compile this analysis.