One number investors use to benchmark SaaS startups across sectors and industries is sales efficiency. There are a handful of variants of this metric, sometimes called the magic number, but ultimately they all aim to provide some sense of the incremental revenue returned by sales and marketing investment.
To make it more concrete, if a startup invests $500k in marketing and sales this quarter and generates $1M in incremental revenue, net of the cost to provide the service, for the next 12 months, the sales efficiency would be 2.
The inverse of the sales efficiency is payback period. In the example above, customer revenue reimburses sales and marketing costs in ½ year or about 6 months.
Sales efficiency is a helpful, high-level indicator. When sales efficiency figures fall below one and elongate pay-back periods, it’s likely time to revisit sales and marketing techniques or explore up-sell and cross-sell. When these figures exceed one, it’s likely time for a business to invest more capital into the sales and marketing efforts.
Below are the sales efficiency benchmarks for the approximately 20 publicly traded SaaS companies calculated on an annual basis by years since founding.
I used revenue x gross margin in these analysis, rather than contribution revenue (revenue - COGS on a unit basis) because the public financials for these businesses don’t reveal unit economics. Thanks to @angusdav for making this point. The raw data is here.
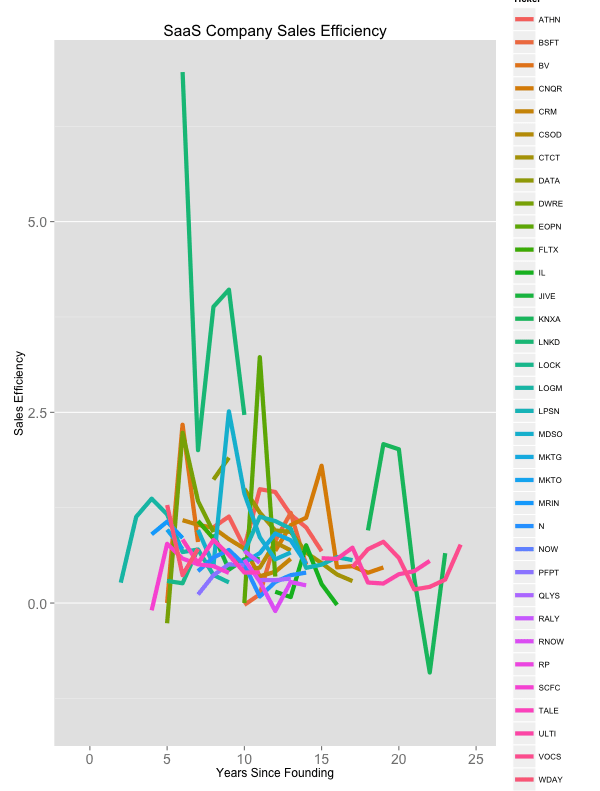
There is wide variance among them. LinkedIn is the upper outlier. I suspect their tremendous efficiency is driven by the network effect growth coupled to four products sold mostly through self-sign up (ads, recruiting subscription product, a sales subscription product and a consumer subscription).
Most SaaS companies operate around the 0.8 mark, meaning the business pays back the cost of the revenue and sales expense in the 5 quarters of the customer. Obviously, contract durations and churn rates are critical components of these figures that are masked by the sales efficiency metric.
The figure below smooths the magic numbers across these companies and removes the outliers.
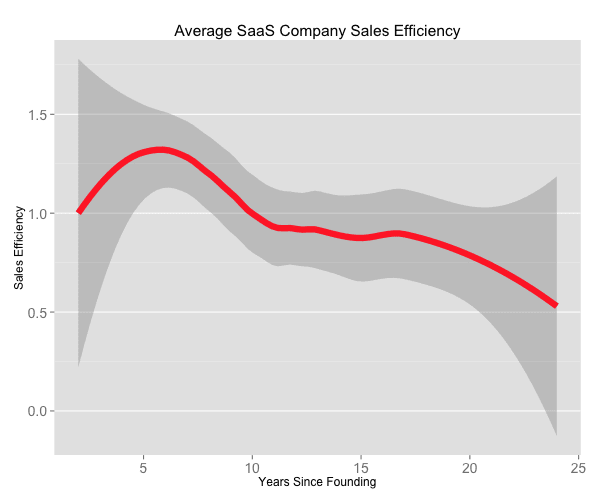
In a company’s early years, rapid growth is driven through efficient sales and marketing spend. Over time, as companies mature and reach market saturation, the sales efficiency decreases, lengthening payback periods for marketing and sales investment.
The sales efficiency metric is a solid high level indicator of sales and marketing performance and a useful management tool.