---
title: "The Blockbuster Software M\u0026A Market of 2018"
description: "Unprecedented software M\u0026A valuations hit 17.7x revenue multiples in 2018, shattering 7-year records. See why growth drives record-breaking exits in tech."
categories: ["exits","trends","data analysis","startups"]
keywords: ["software M\u0026A","M\u0026A multiples","2018 software acquisitions","Tomasz Tunguz","venture capital","tech exits","SaaS growth","enterprise value to revenue"]
ai_summary: "In 2018, software M\u0026A reached record valuations with a median 17.7x revenue multiple, driven by growth and innovation."
date: 2018-06-12
lastmod: 2026-07-31
canonical_url: https://www.tomtunguz.com/mid-2018-ma/
author: "Tomasz Tunguz"
---
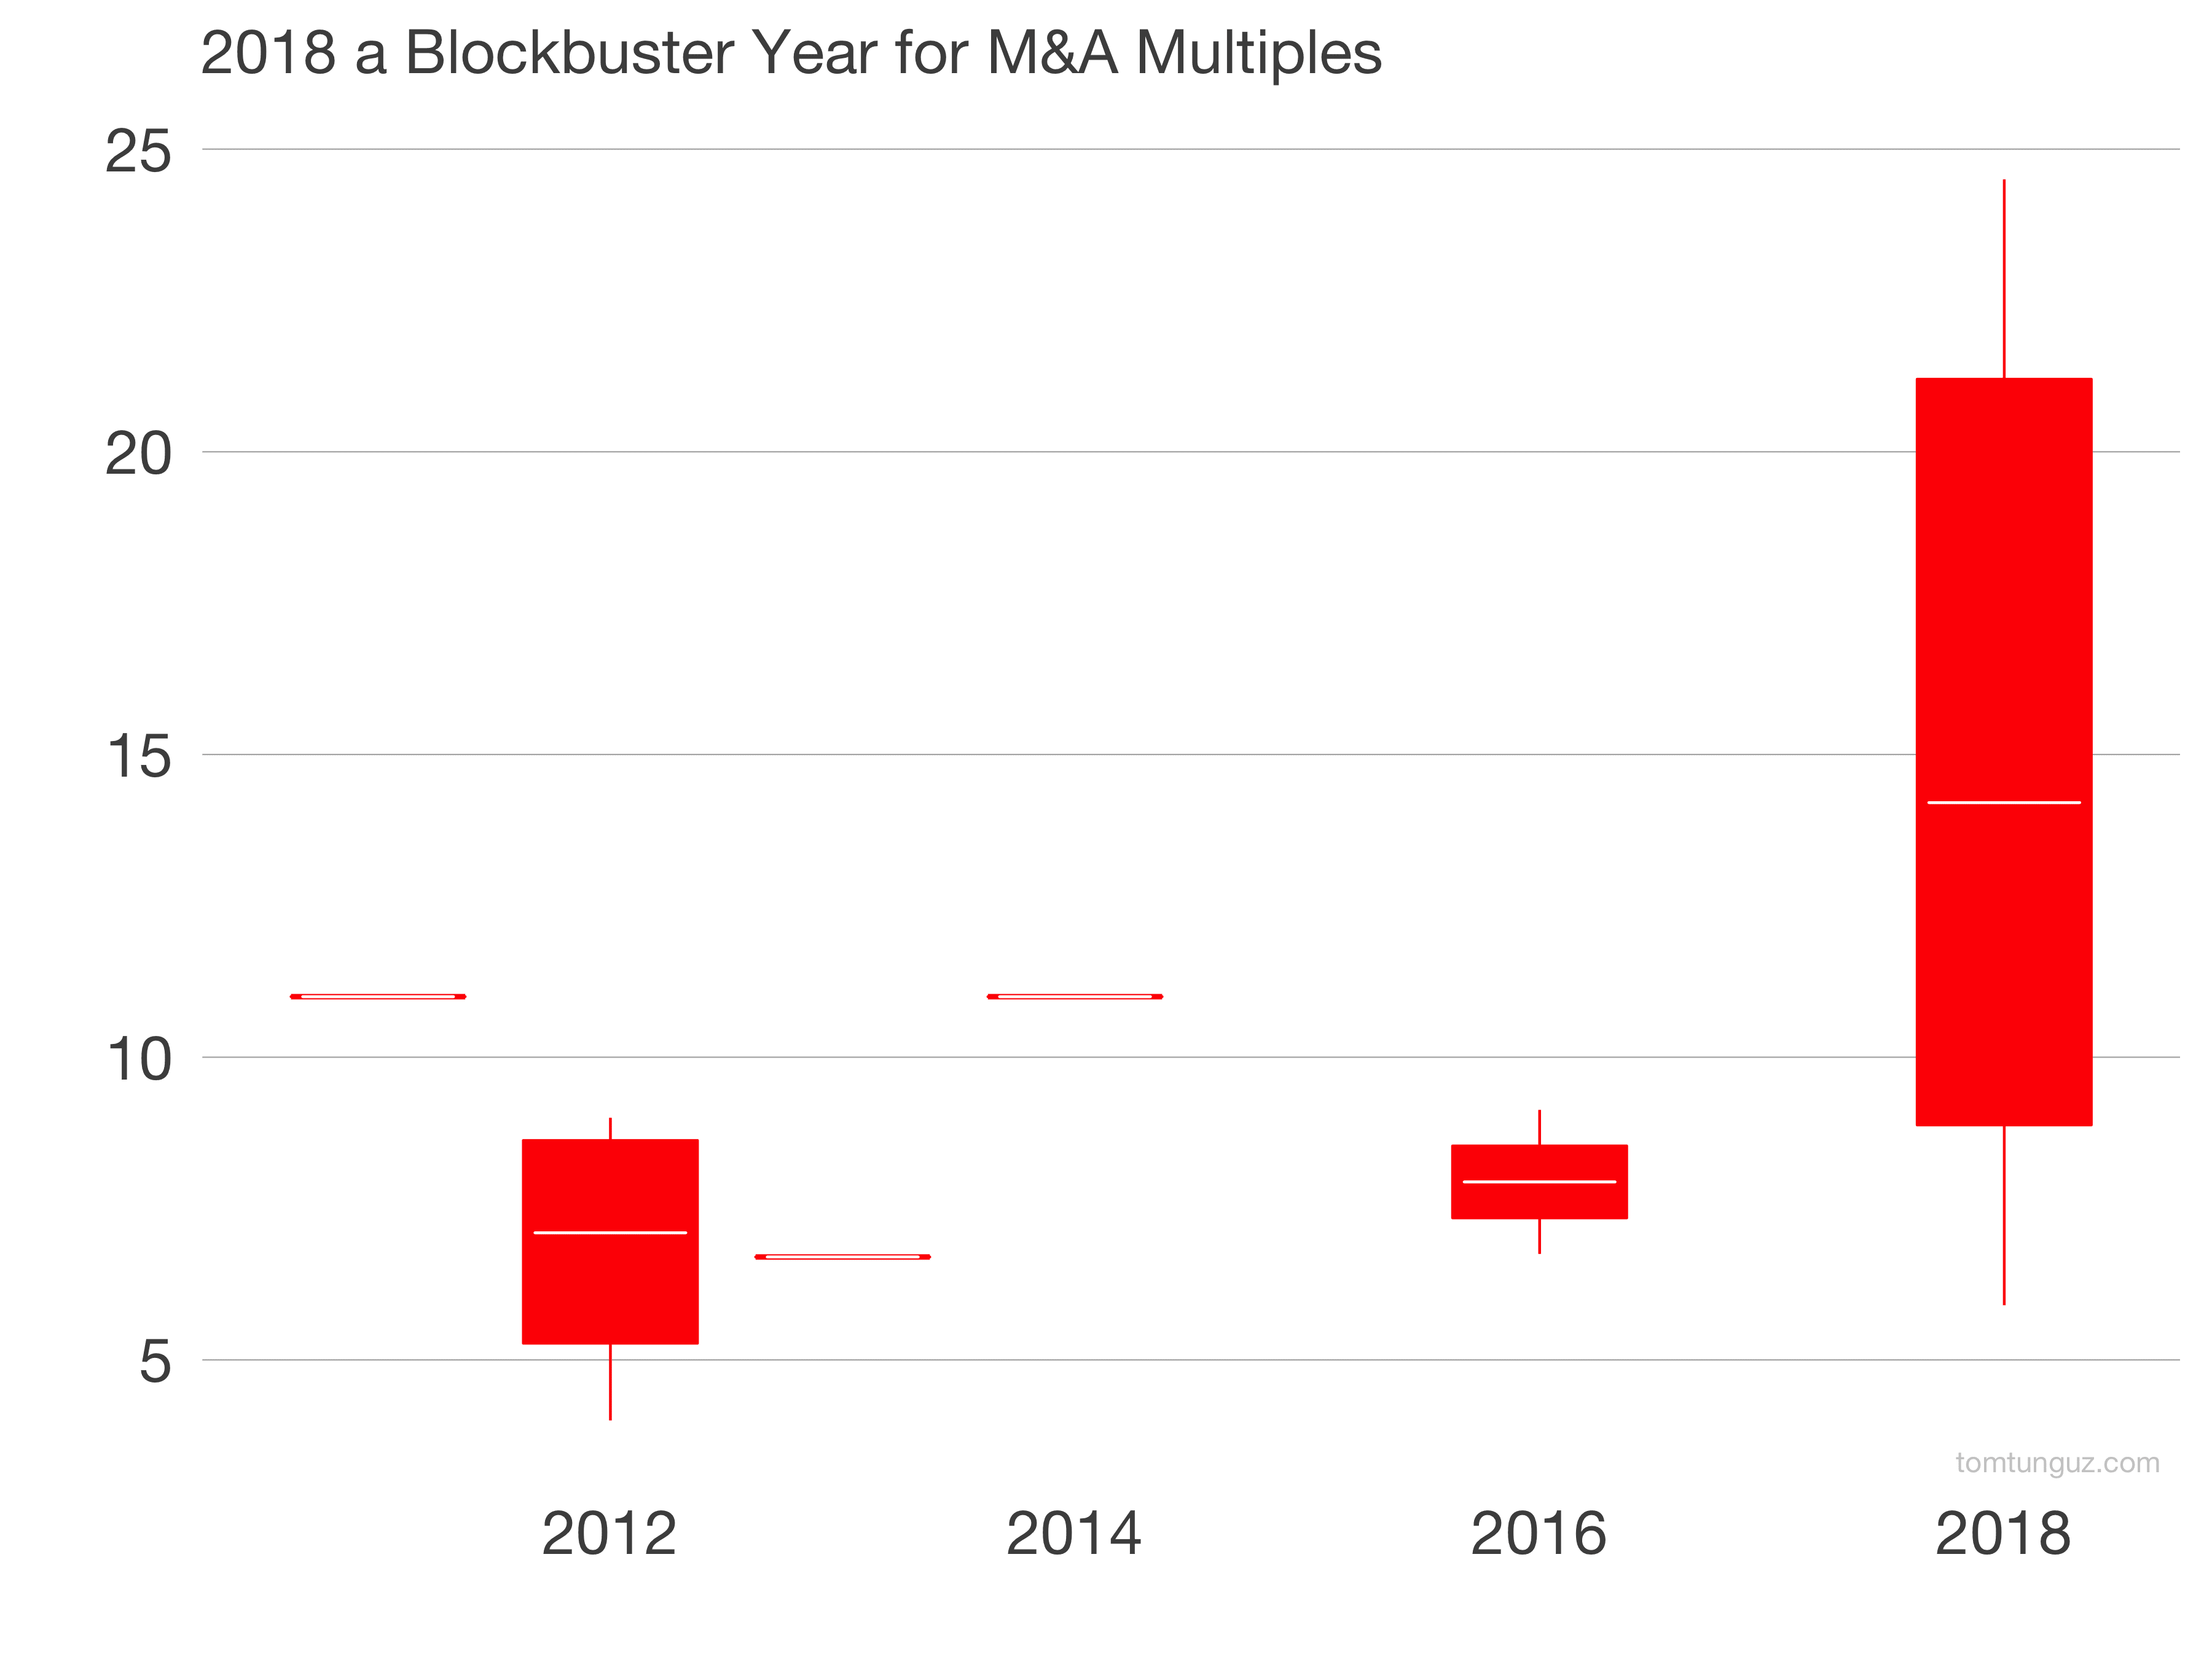
2018 is a blockbuster year for software M&A multiples. The prices companies fetch relative to their revenues surpass any of those in the past 7 years. Billion-dollar plus acquisitions in 2018 have commanded a median 17.7x trailing enterprise value to revenue multiple. Nothing in the past seven years is close. In fact, there is not a single acquisition in that range.
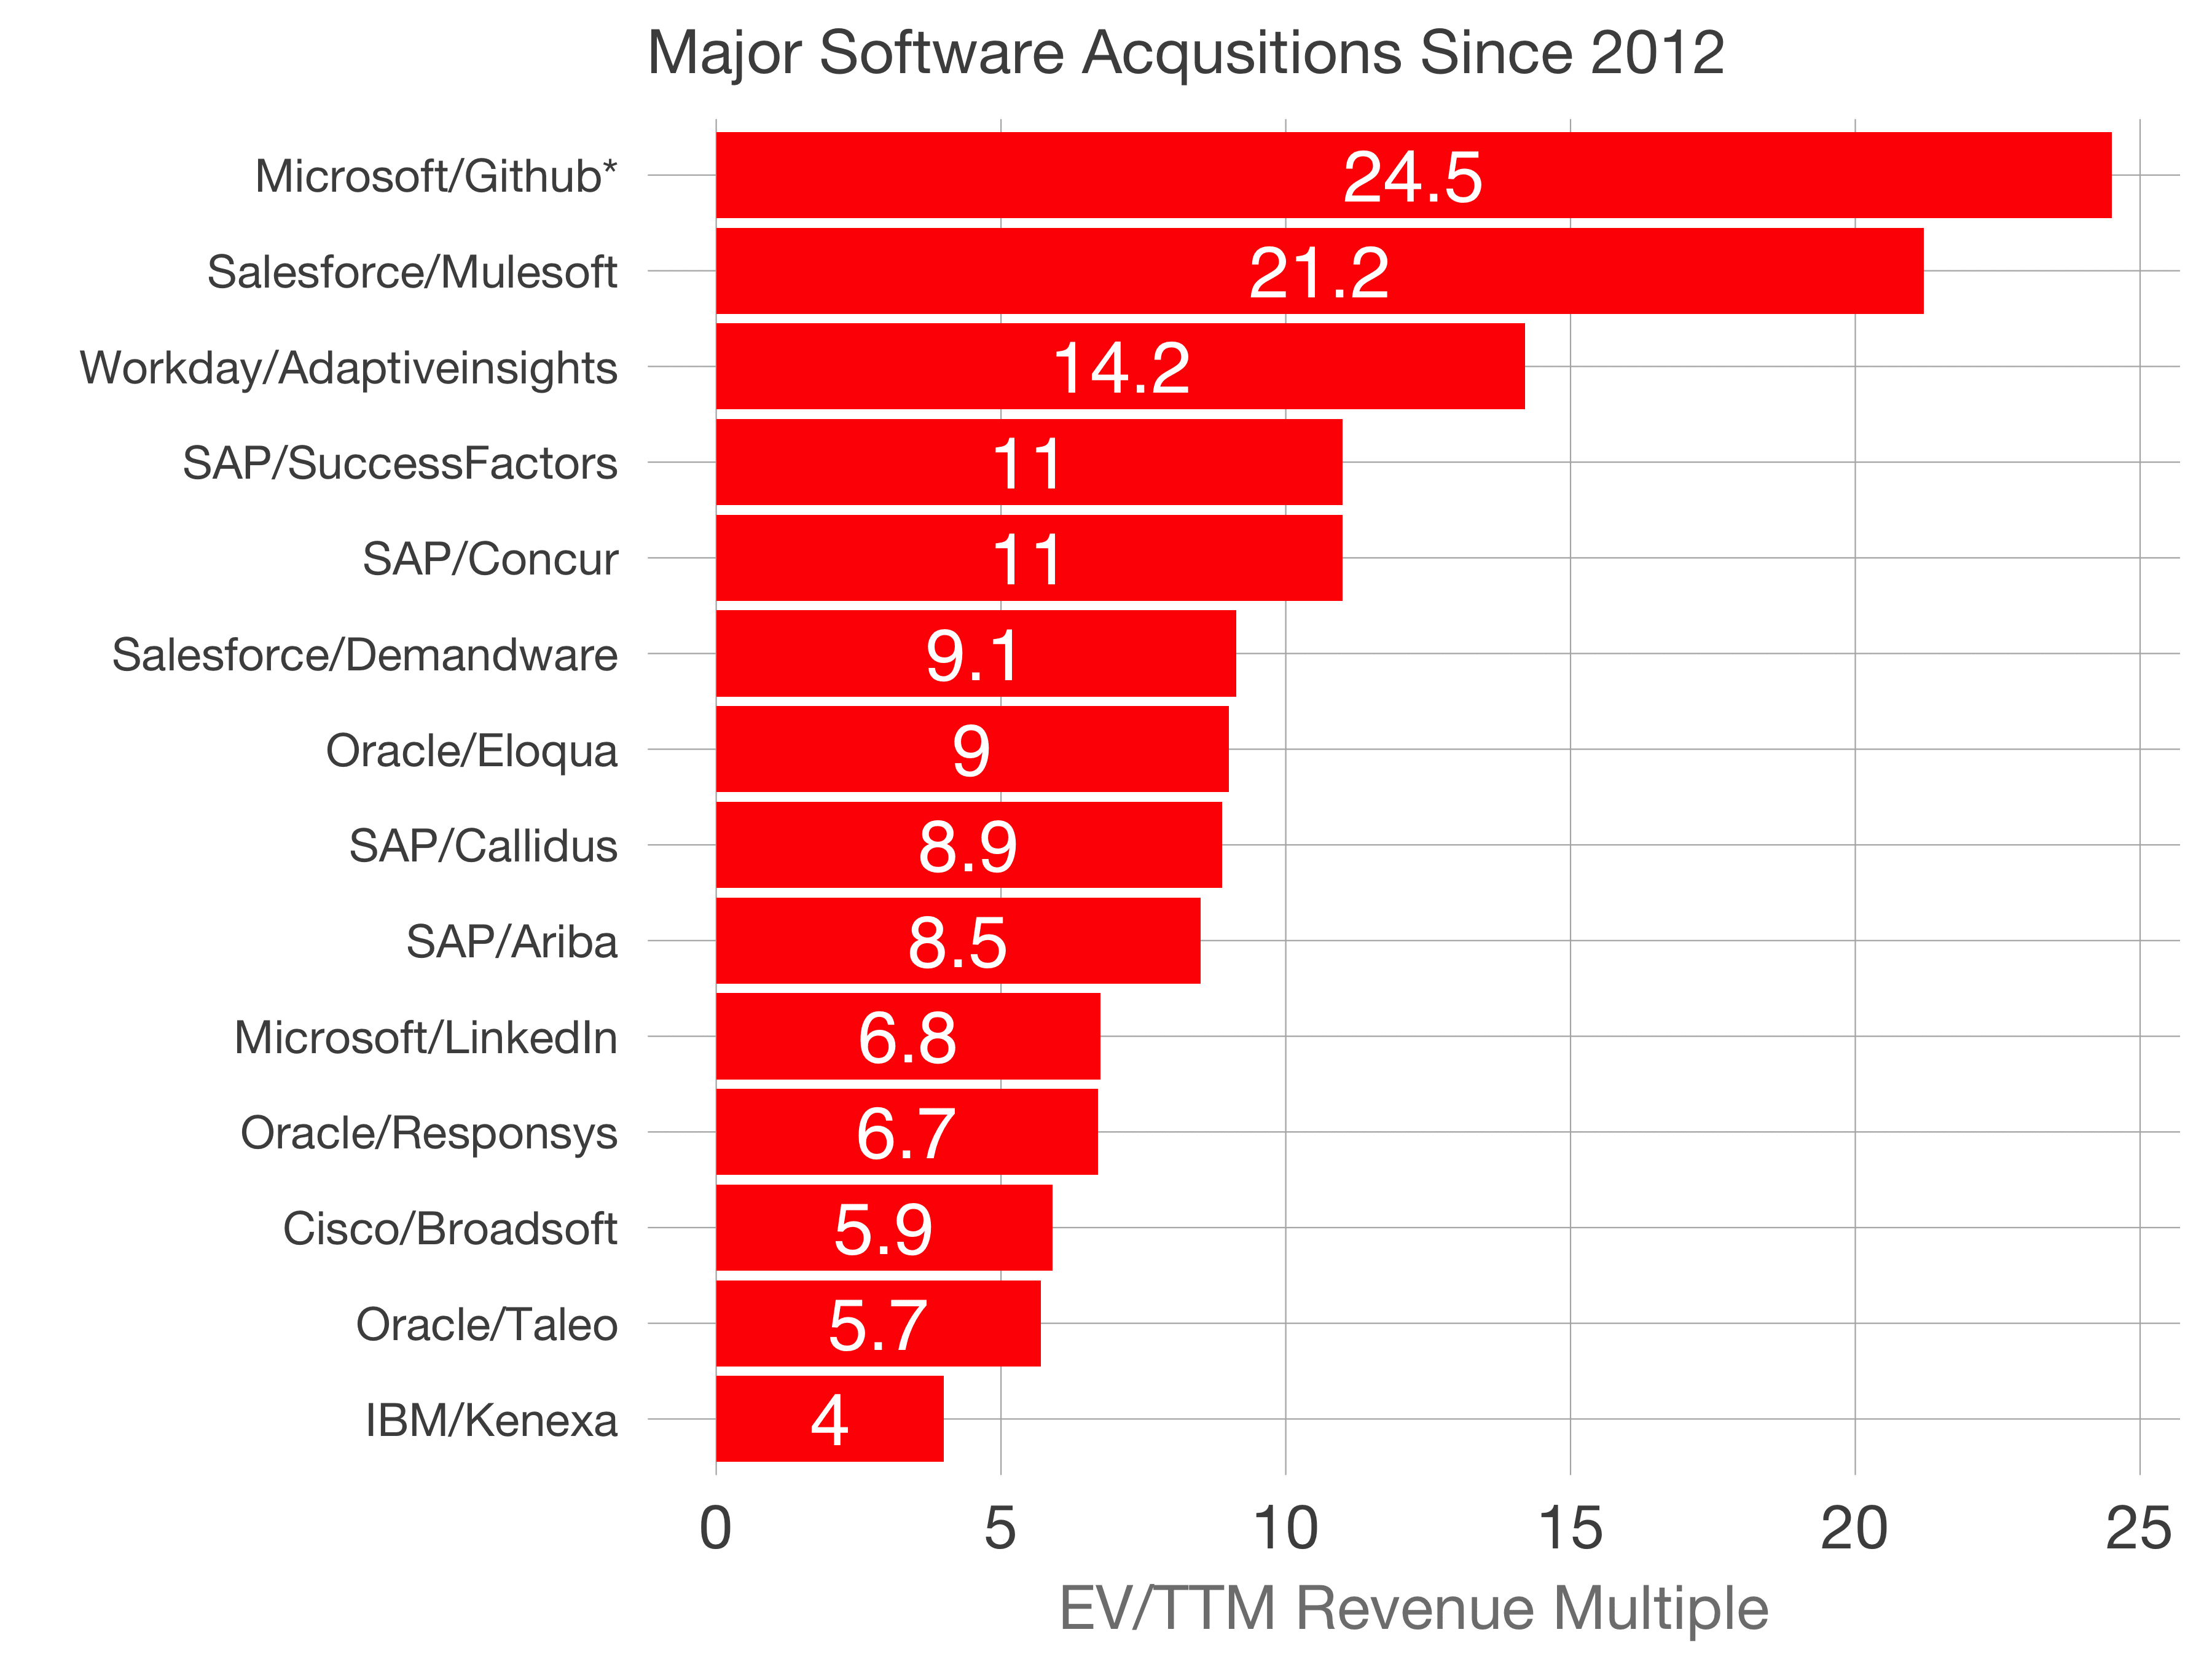
In 2018, three acquirers have paid greater than 14x trailing multiples, and two have paid greater than 20x trailing. The [vibrant M&A market we expected](http://tomtunguz.com/predictions-for-2018/) is fructifying.
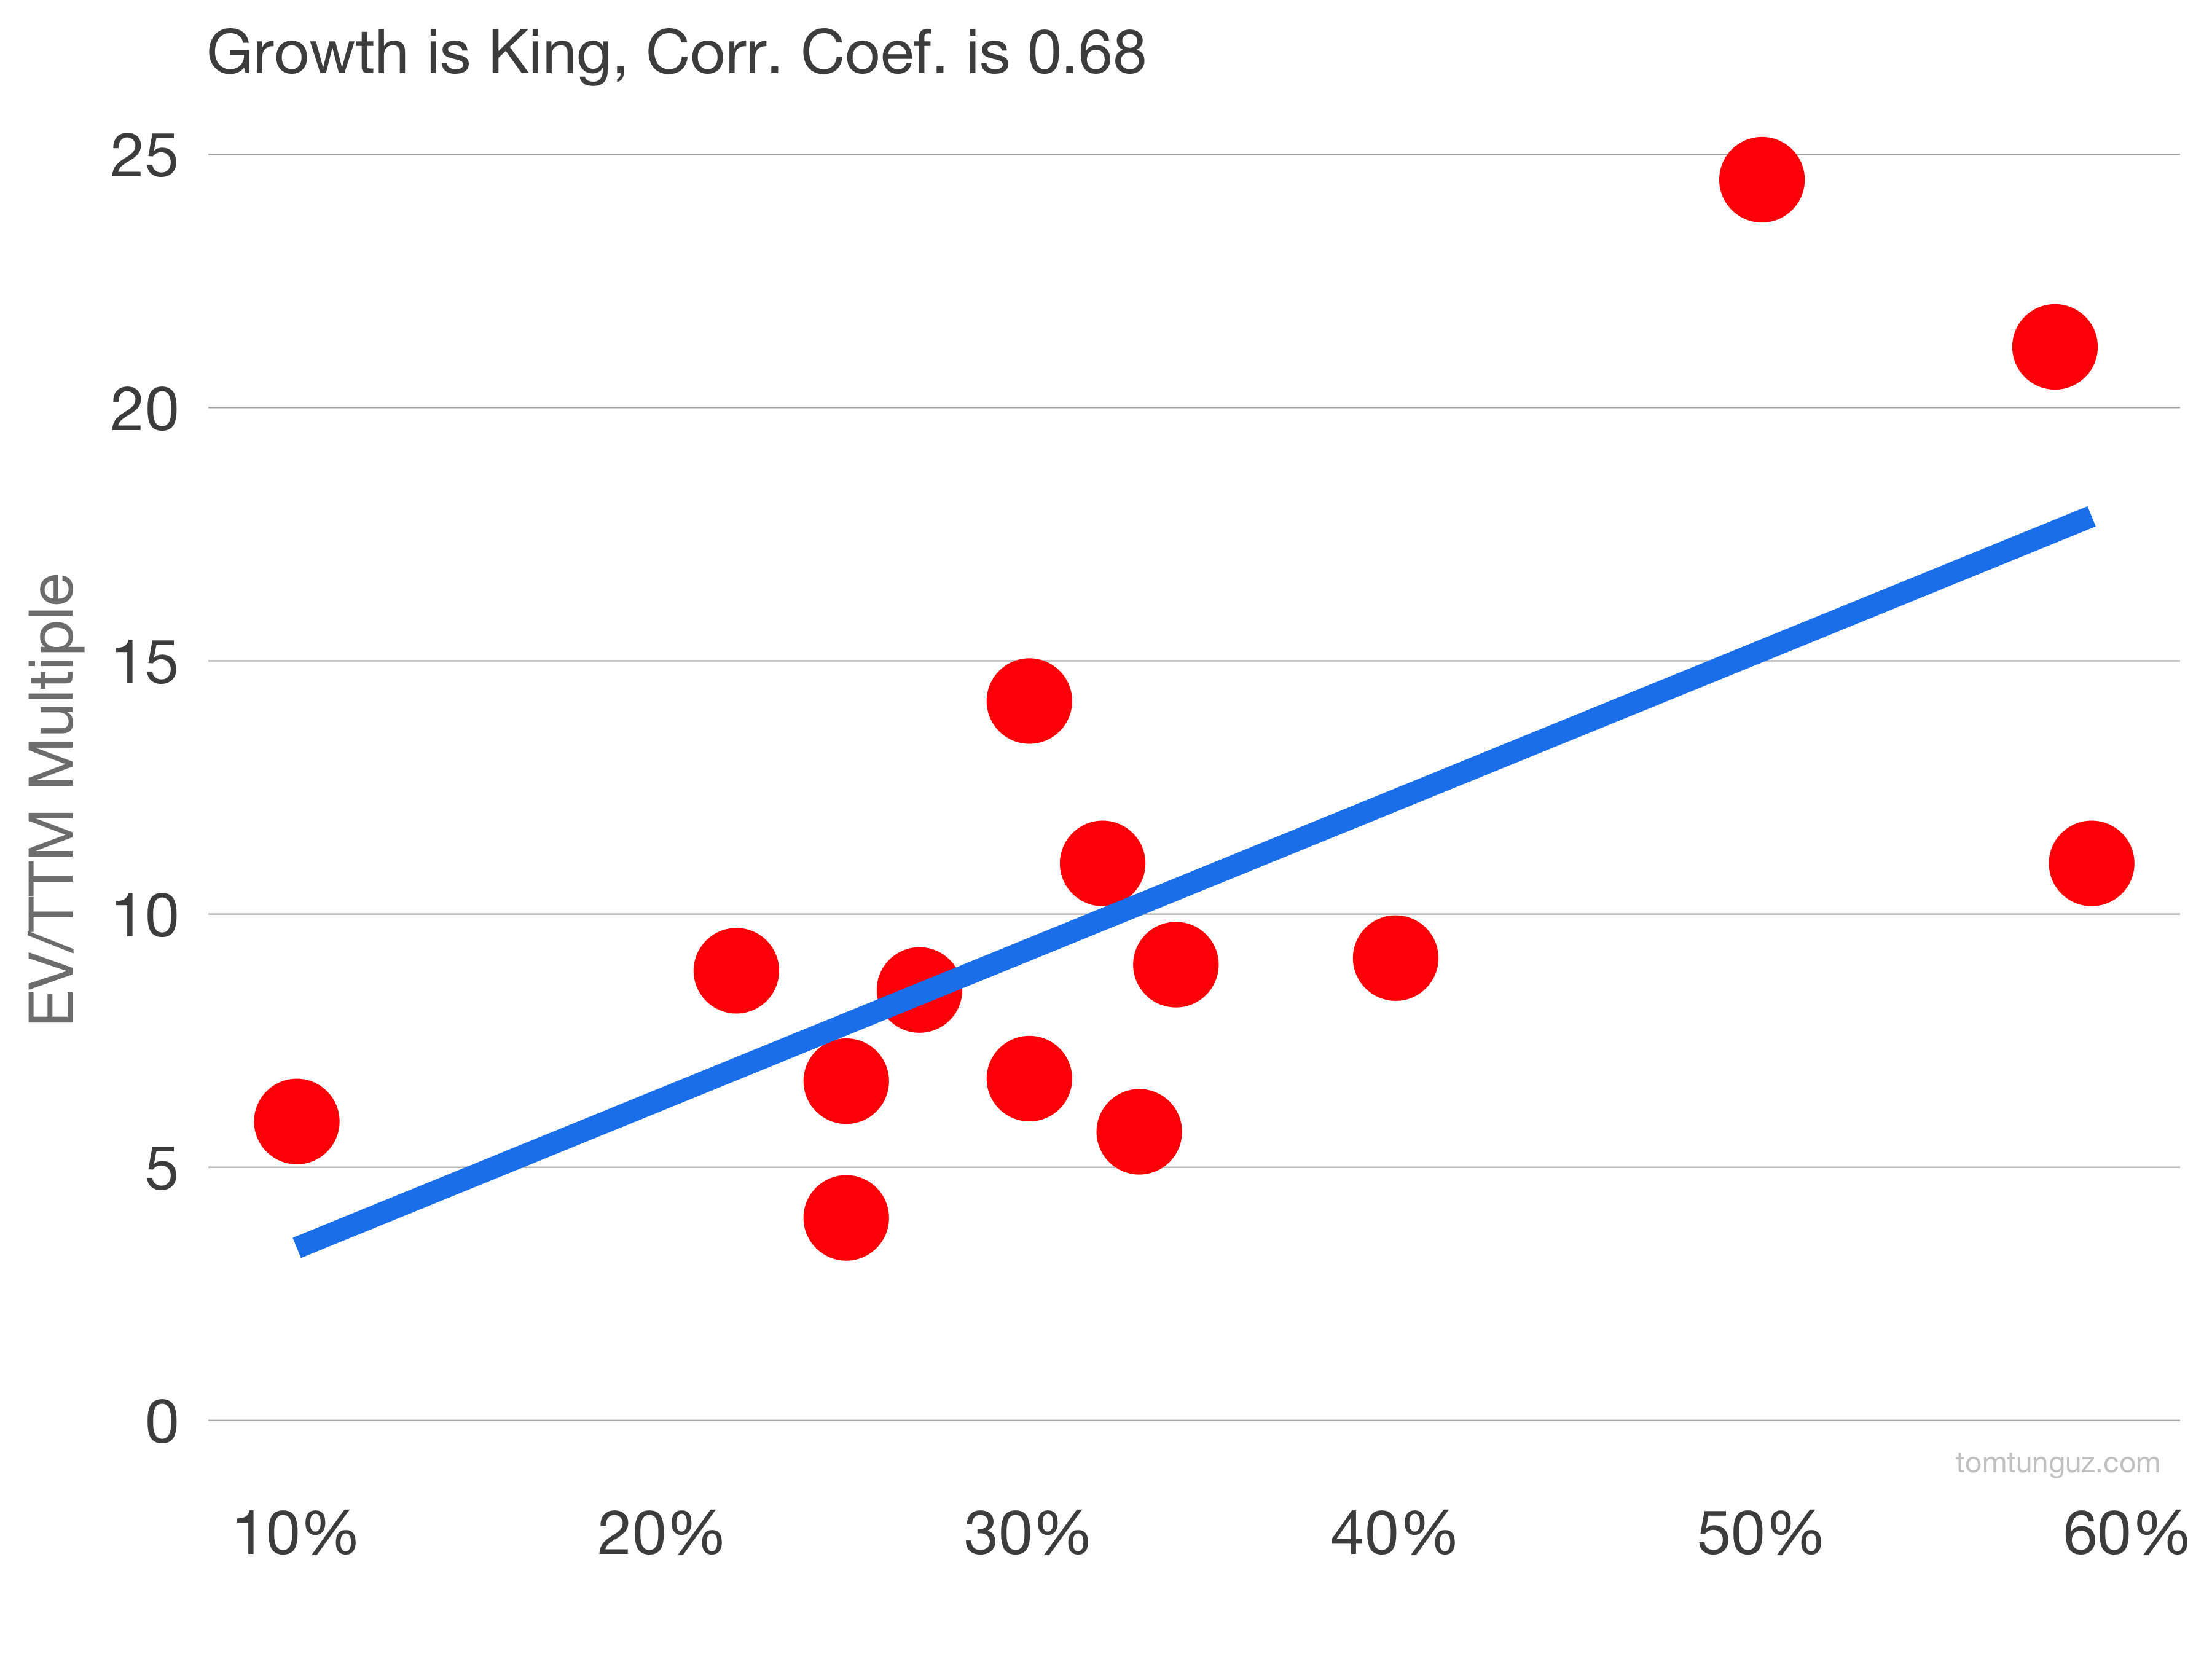
Growth remains the most important correlating factor to sale price. The strength of the correlation has fallen a bit since we calculated this earlier in the year from 0.72 to 0.68. That small decline is driven by Cisco's acquisition of Broadsoft earlier in 2018, but does nothing to change the conclusion that acquirers prize growth.
The major forces at play at the beginning of the year remain influential today. Consequently, I expect substantially more acquisitions of the scale and at these multiples through 2018. The corporate tax holiday. The growing sizes of the software market. The desire for continuing growth. The pace of innovation within software. The increasing competition amongst incumbents. A vibrant public market that is continuing to price companies aggressively. As I wrote earlier this week, forward software multiples have reached eight year highs at 8.5x EV/NTM revenues.
It's a great time to sell a fast growing billion dollar company.
Full data below.
| Transaction | Price | TTM Rev | Y/Y Growth | Gross Margin | Year of Sale | EV | EV/TTM |
| ------------------------ | ----- | ------- | ---------- | ------------ | ------------ | ----- | ------ |
| Microsoft/Github* | 7500 | 300 | 50% | | 2018 | 7350 | 24.5 |
| Salesforce/Mulesoft | 6500 | 297 | 58% | 73% | 2018 | 6296 | 21.2 |
| Workday/Adaptiveinsights | 1550 | 107 | 30% | 74% | 2018 | 1520 | 14.2 |
| SAP/Concur | 8300 | 546 | 32% | 63% | 2014 | 5988 | 11 |
| SAP/SuccessFactors | 3764 | 328 | 59% | 66% | 2011 | 3599 | 11 |
| Salesforce/Demandware | 2800 | 274 | 40% | 71% | 2016 | 2502 | 9.1 |
| Oracle/Eloqua | 957 | 95.8 | 34% | 72% | 2012 | 864 | 9 |
| SAP/Callidus | 2400 | 253 | 22% | 61% | 2018 | 2247 | 8.9 |
| SAP/Ariba | 4607 | 517 | 27% | 66% | 2012 | 4390 | 8.5 |
| Microsoft/LinkedIn | 26500 | 3615 | 30% | 87% | 2016 | 24385 | 6.8 |
| Oracle/Responsys | 1770 | 194 | 25% | 53% | 2013 | 1291 | 6.7 |
| Cisco/Broadsoft | 2288 | 362 | 10% | 72% | 2018 | 2137 | 5.9 |
| Oracle/Taleo | 1921 | 315 | 33% | 67% | 2012 | 1805 | 5.7 |
| IBM/Kenexa | 1397 | 333 | 25% | 61% | 2012 | 1332 | 4 |
*Github data is estimated from public news reports [here](https://www.cnbc.com/2018/06/05/github-interest-from-google-and-others-revenue-about-300-million.html) and [here](https://www.cnbc.com/2017/10/11/github-has-a-110-million-run-rate-from-business-products.html). All other data originates from public filings or disclosures