Following this week’s post Benchmarking HubSpot’s S-1, Josh and Nikos raised an interesting question on Twitter. What are the right ways to benchmark SaaS companies from their early days through IPO? I have always used years-since-founding as the time axis to compare companies, because if I were a founder, that’s how I might think about benchmarks. But after their comments I wondered if there were better ones.
Some potential alternatives are:
- Using time before/since-IPO for the time axis.
- Grouping companies by ACV to compare growth rates
- Grouping companies by Revenue at IPO to compare growth rates
First, let’s compare using years-since-founding to years before/after-IPO. Below I’ve plotted revenue growth for each of these two timelines.

I’ve applied a basic predictive function (loess), which is marked in blue. In the first chart, the predictor does a fairly good job of capturing the spirit of the data. There are one or two outliers growing at 200%+, but the curve matches the data set pretty well.

When plotting the same data by year since IPO, the data is much more dispersed. Consequently, the predictor’s fit isn’t as good and the relationship isn’t as strong. In fact, the years-since-founding predictor is twice as accurate, recording an R^2 value, a measure of line-fitting accuracy, more than twice as big as the IPO-based x-axis.
The argument for using years before/since IPO is that startups may be founded in tougher fundraising environments, pursue a pivot or take some other scenic route to IPO, which would delay their revenue growth when compared to other companies on a years-since-founding axis. But the data suggests this is a pretty infrequent occurrence.
Nikos suggested using years since $1M ARR. Unfortunately, since most companies only report 2-3 years of revenue before their IPO, I’m able to calculate the year of $1M in ARR for only than 15% of companies in my dataset. Increasing the ARR figure to $10M captures about 50% of companies. But years-since-founding includes all the companies’ data points.
In this case, I believe more data is better. So, I’m going to keep using years-since-founding because it’s a more consistent predictor and the data set is larger, which ought to provide the better context for benchmarking.
As for grouping companies in benchmark buckets rather than using the global median, we could create buckets based on average customer value and determine if the growth rates at IPO are correlated.

Above I’ve plotted growth rate in the year of IPO and the ACV bucket, grouped by $25k increments. I’ve excluded a few outliers like Veeva and Medidata which have $1M+ ACVs. Unfortunately, there’s no relationship between the value of a customer and a company’s growth rate at IPO - the data points are all over the map. This conclusion is a corollary to another analysis, The Optimal Average Customer Value for SaaS Startups, which suggested that multi-billion dollar SaaS companies can be built at any price point. Bucketing by ACV for revenue growth won’t shed much more insight into benchmarks than the raw median.
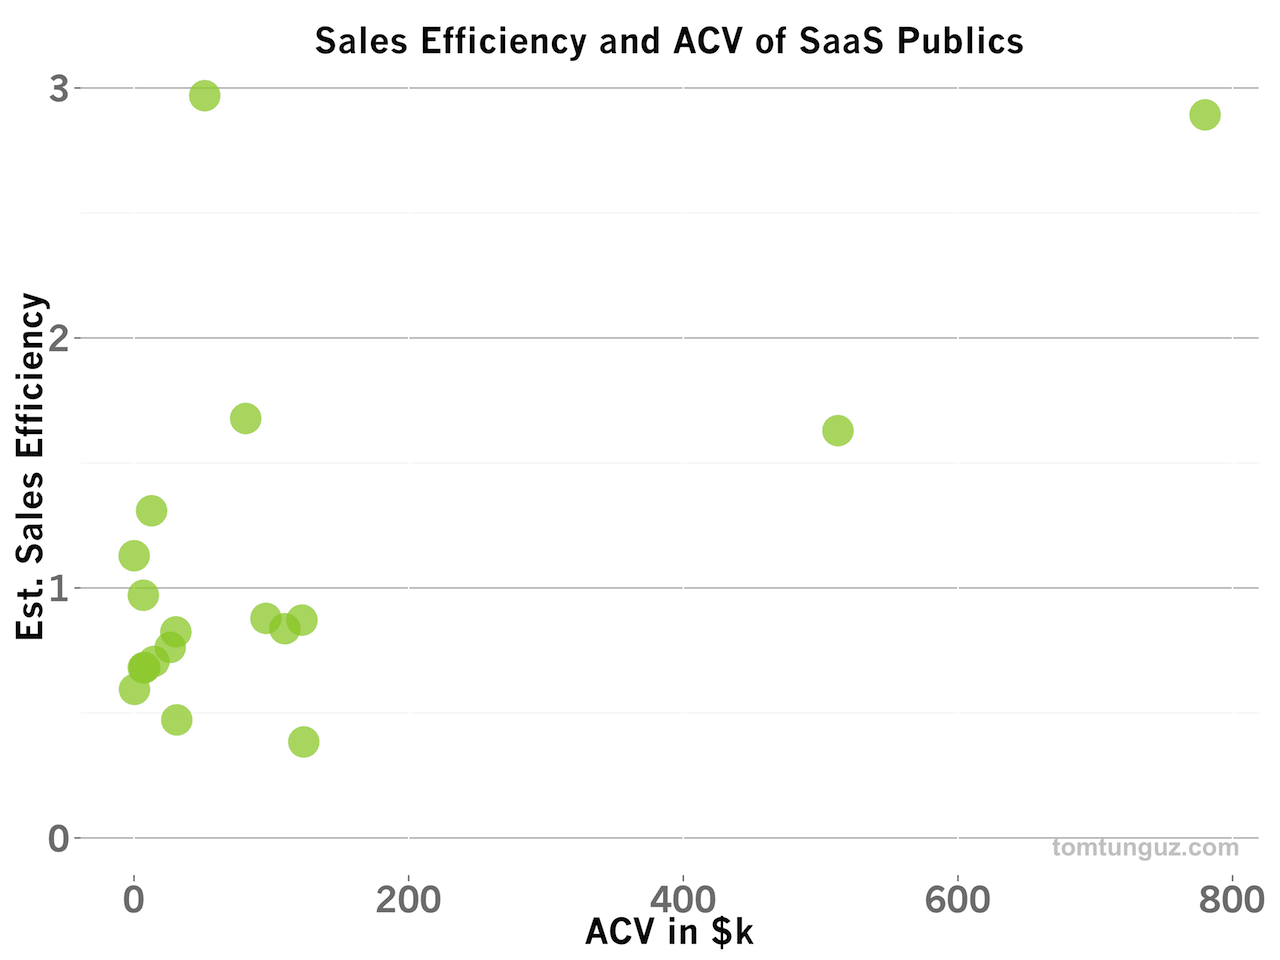
Additionally, there’s no clear correlation between ACV and Sales Efficiency, as the plot above shows, so bucketing by ACV wouldn’t make sense for evaluating the go-to-market effectiveness of a SaaS company.
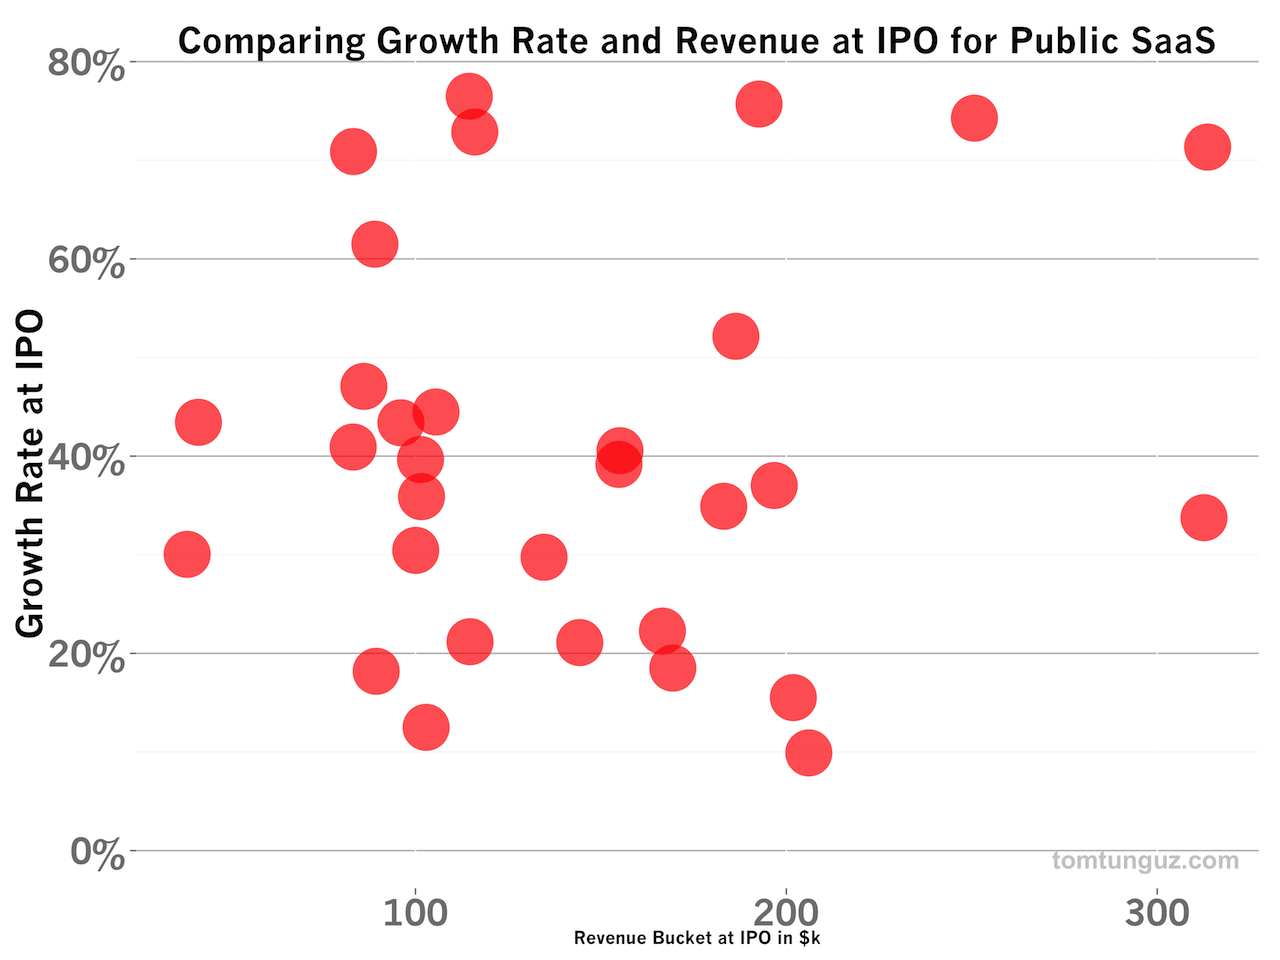
An alternative bucketing system for benchmarking might aggregate companies generating similar revenue levels at IPO. Above, I’ve plotted the growth rates by Revenue Bucket from $0-300M in groups of $50M. Again, it’s pretty clear there is no clustering, which would indicate companies of a particular revenue size grow at different rates at IPO.
There’s simply no pattern with this data. So I’m going to stick with the years since founding and a broad median to benchmark SaaS companies. Of course, my goal with the S-1 analysis of HubSpot and Box, and others in the future, as well as all the benchmarking I publish, is to help founders. If you have ideas for better ways to analyze or present the data, please send me an email or tweet with ideas. I’d love to explore them.