---
title: "Will We See a Better Exit Market Next Year?"
description: "Explore how Fed rate cuts impact startup exits: New data shows 10-65% increase in venture-backed M\u0026A activity when rates drop. Key insights for founders \u0026 VCs."
categories: ["exits","data analysis"]
keywords: ["Theory Ventures","Tomasz Tunguz","venture capital","startup exits","M\u0026A activity","Fed rate cuts","monetary policy","cost of capital"]
ai_summary: "Fed rate cuts may boost startup exit activity by 10-65%, offering insights for founders and VCs on market trends."
date: 2024-09-20
lastmod: 2026-07-23
canonical_url: https://www.tomtunguz.com/rates-and-exits/
author: "Tomasz Tunguz"
---
The Fed cut rates by 50 basis points this week. A mantra circulating in Silicon Valley has echoed that the tepid exit markets will revive as a result of a laxer monetary policy.
The last ten years' data suggest the relationship is real & non-linear.1
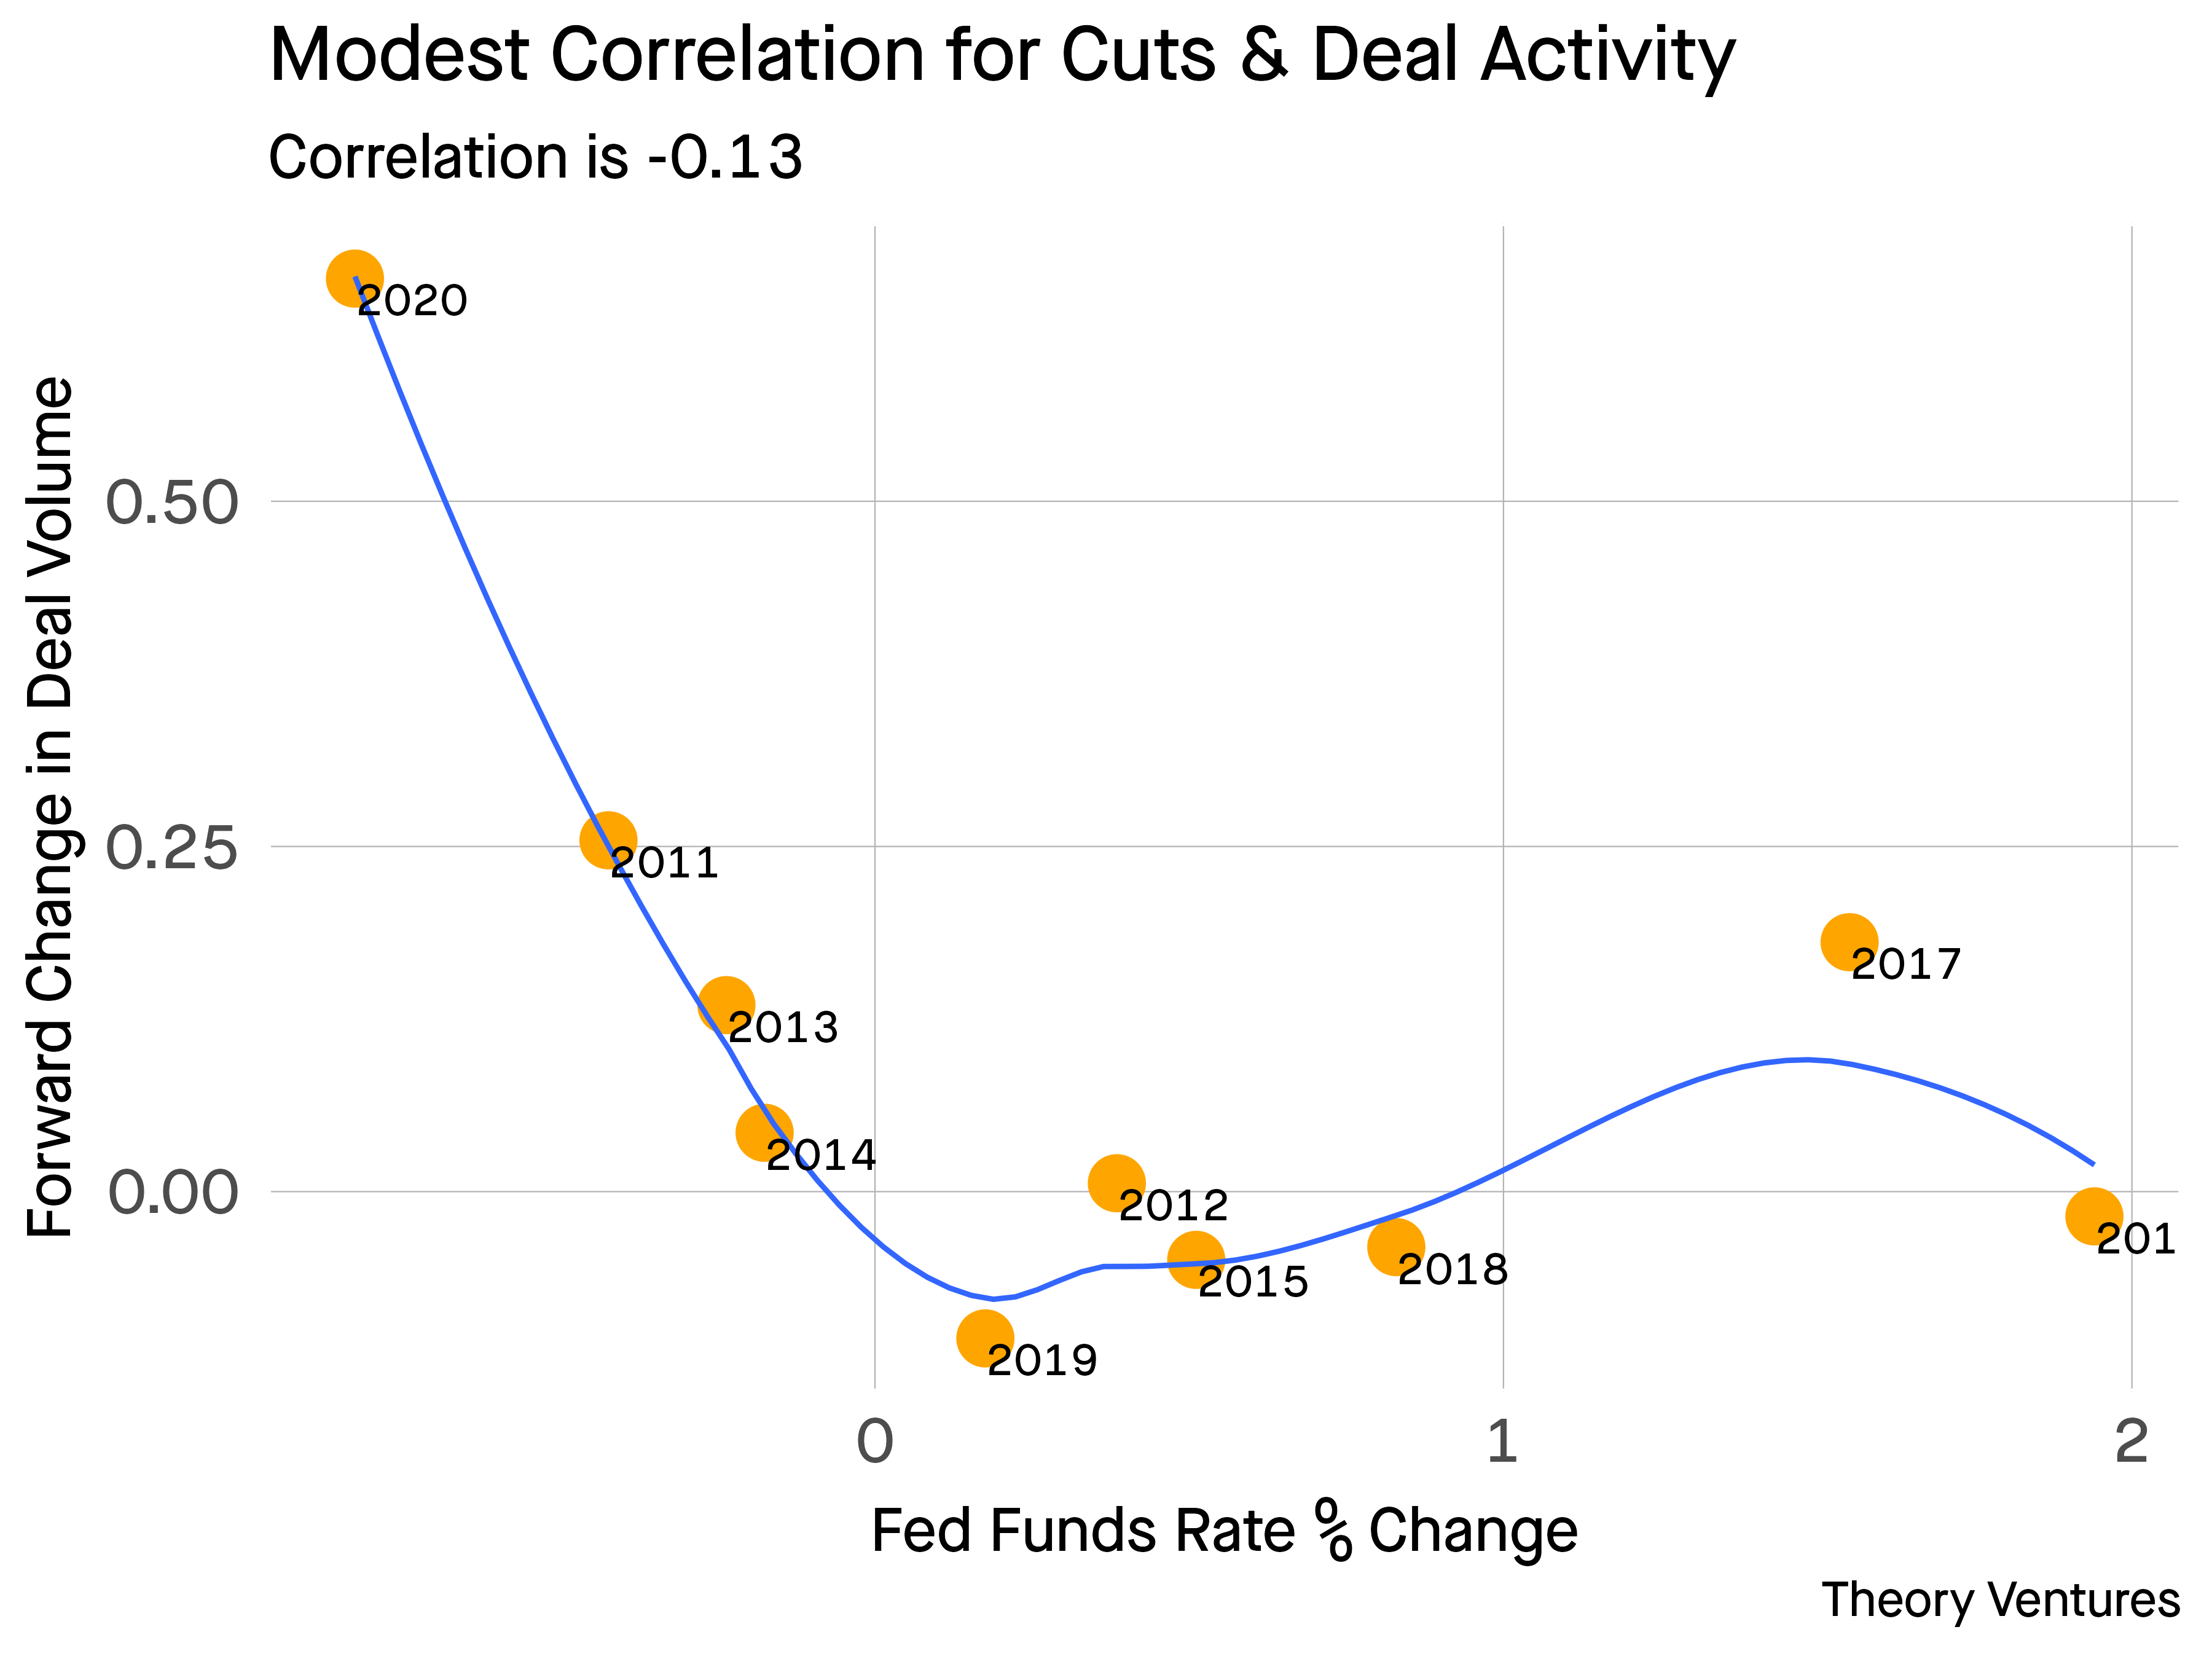
When the Fed cuts rates - negative changes in the Fed Funds Rate (FFR) - US venture backed software exit activity increases by between 10% and 65%. If the FFR increases, M&A activity remains stable. The correlation explains about 25% of the variance, but it's clear from the blue line, the relationship is non-linear.
Rates are [convex](https://en.wikipedia.org/wiki/Bond_convexity) : a cut from 5% to 4.5% has less impact on the cost of capital than a cut from 1% to 0.5%. The same is true for exits.
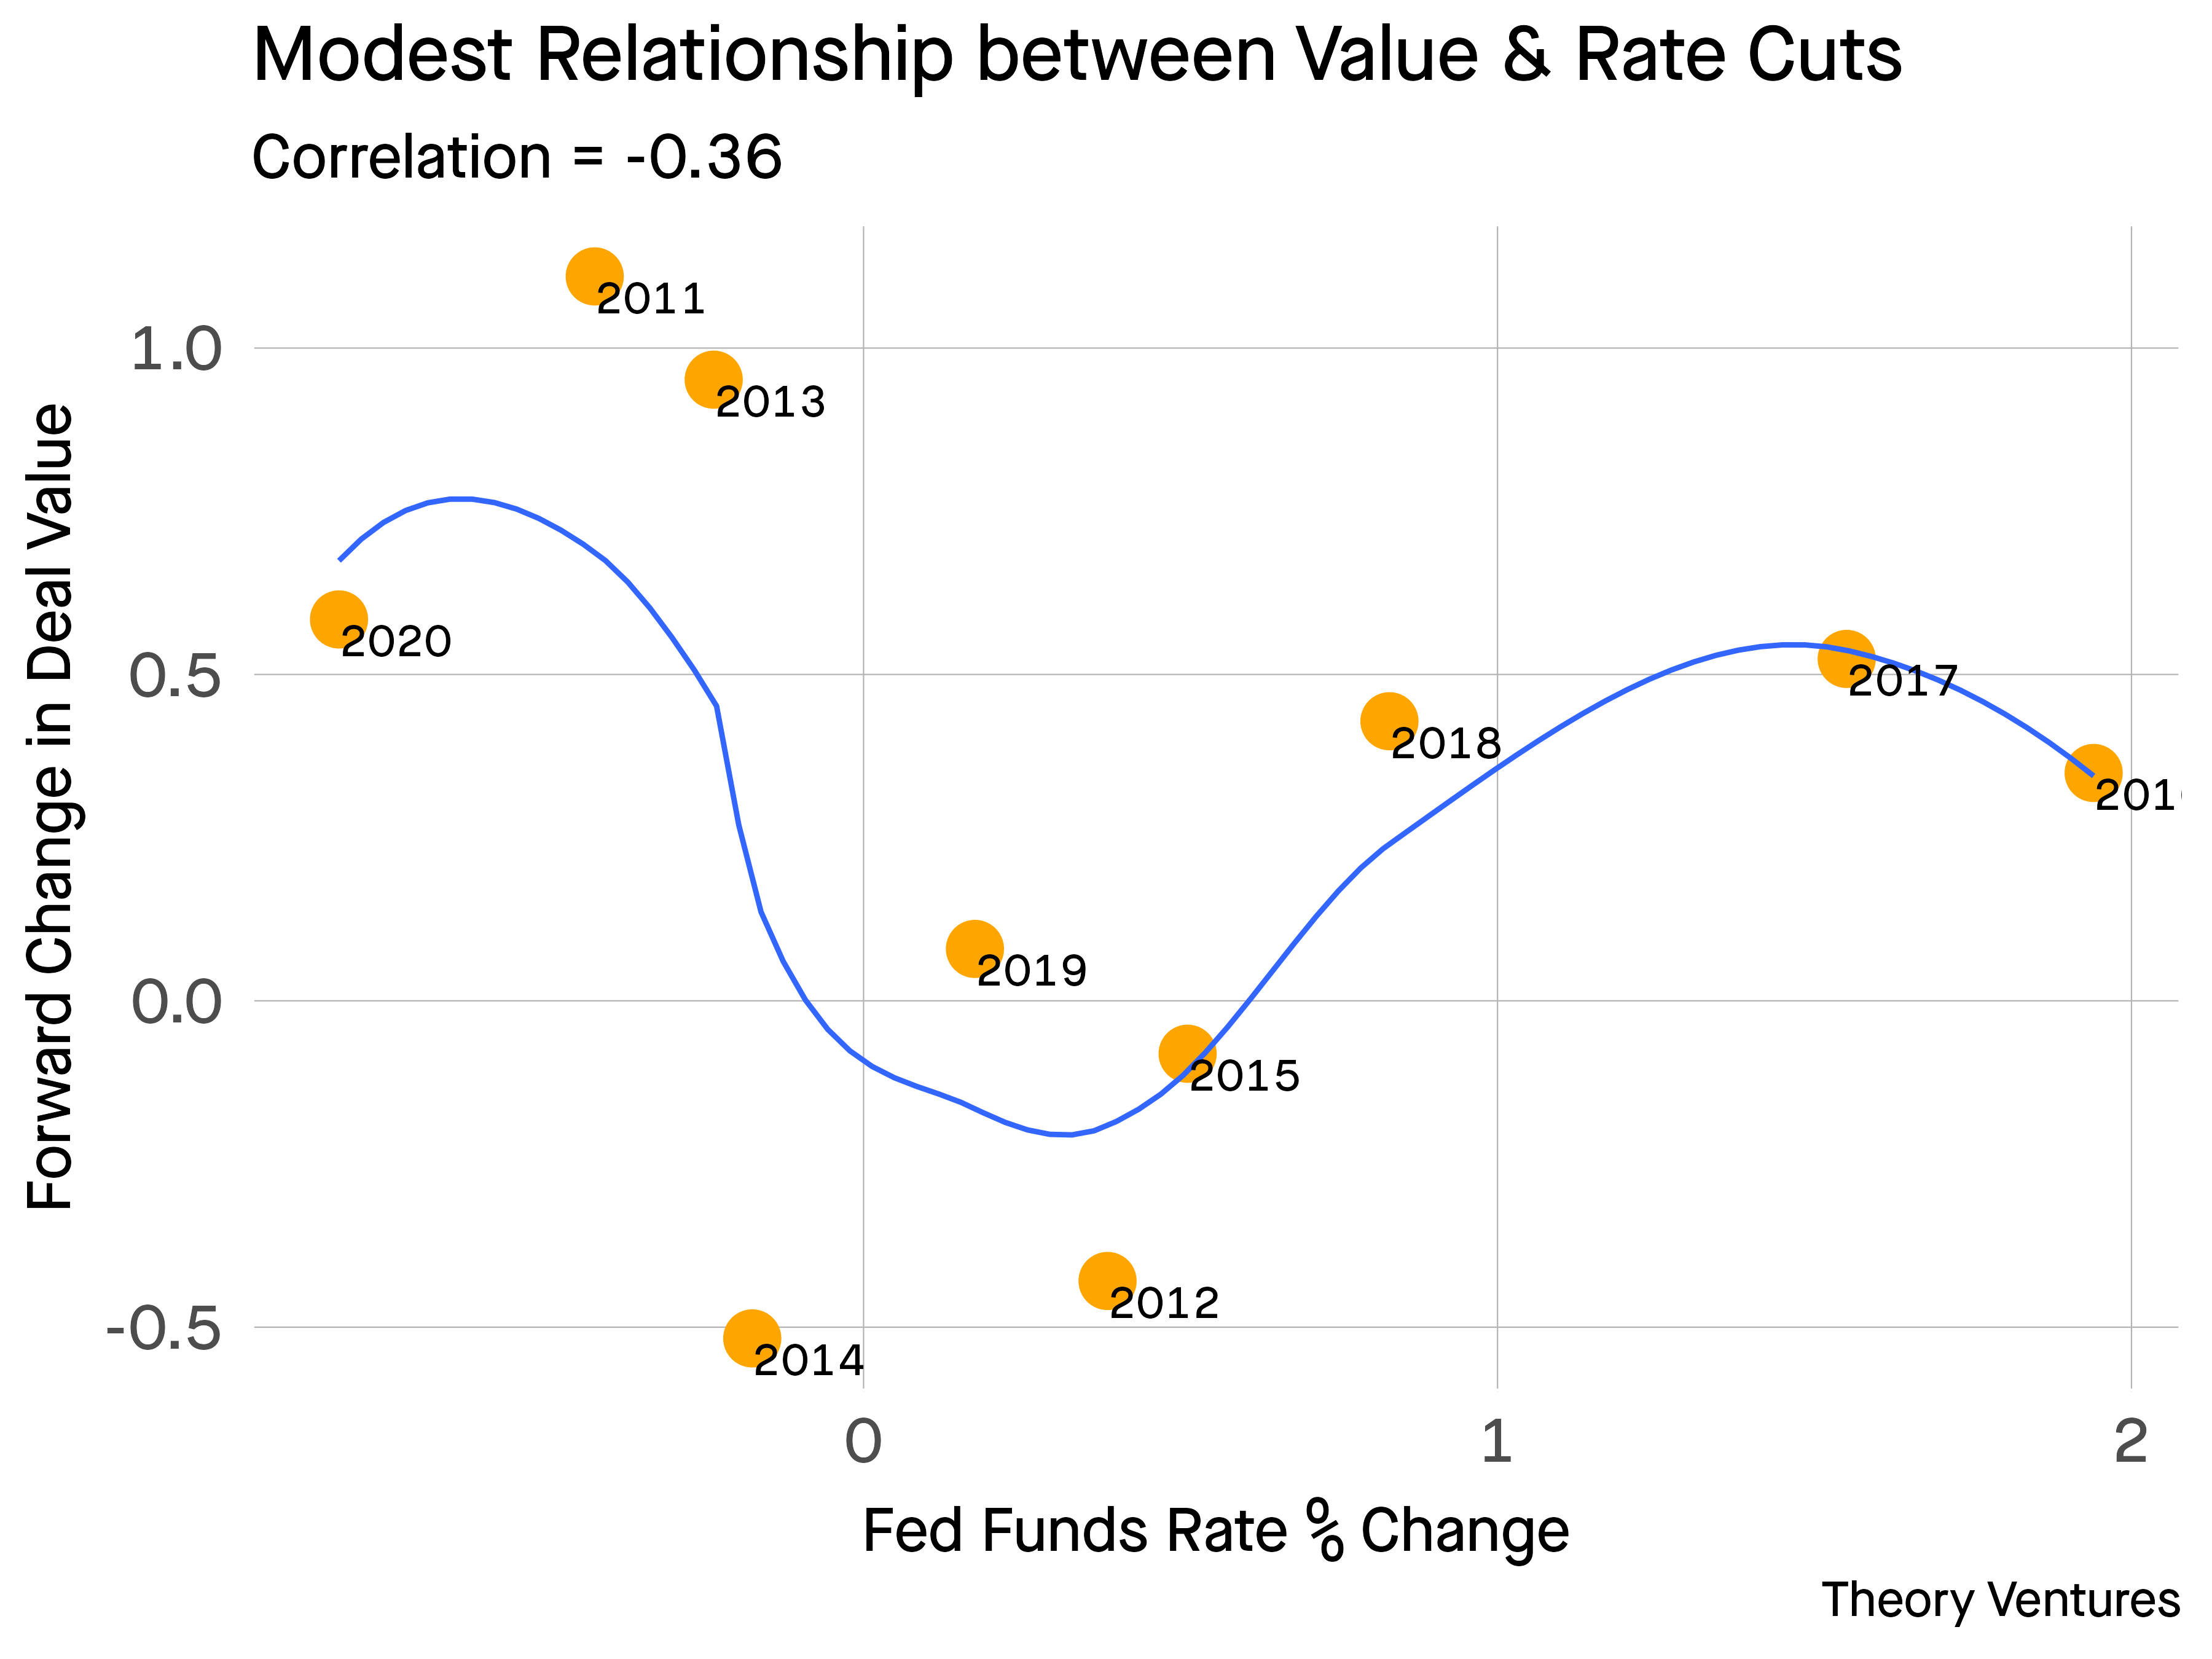
The relationship between deal value & FFR also has some correlation but it's weaker at -0.36 correlation. Looking at the squiggly blue line in the middle of the chart, the perils of overfitting are clear. But there is a U-shaped pattern. When rates move meaningfully positive or negative, deal activity increases.
Why?
Rate decreases reduce the cost of capital spurring acquisition. Rate increases might heighten the imbalance between those with cash who can afford to buy & startups with limited balance sheets who must sell. So the right hand side of the chart may be "forced" M&A.
There is nuance much that isn't captured here :
- impact on valuation multiples. Most likely, lower rates increase valuations & vice-versa since capital is less expensive with lower rates.
- the data set is limited to about a decade during which rates were constant for half & then fluctuated wildly.
- the non-linearity of the data isn't captured by Pearson correlation.
But there is some evidence within the data that laxer monetary policy will increase exit activity in the subsequent twelve months.
---
1I'm using PitchBook US venture backed software exit data & running Spearman correlations on data from 2010-2020 on the subsequent year's change in the relevant field. The blue line is a [loess](https://en.wikipedia.org/wiki/Local_regression) curve.