One way of measuring the efficiency of a company’s revenue model is to benchmark revenue per employee. Google and Facebook, the two most efficient companies, generate $1M per revenue per employee per year.
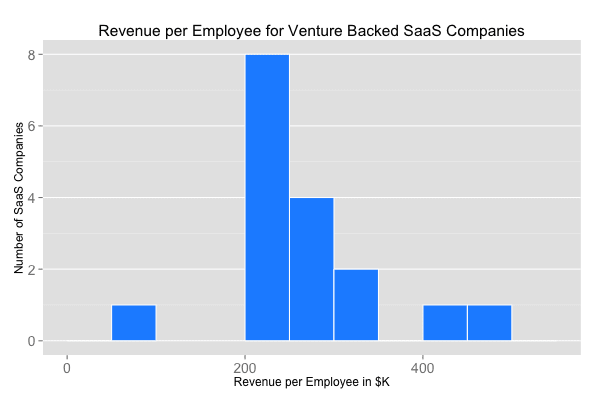
Setting aside those exceptional cases and focusing instead on SaaS companies, the typical average revenue per employee is about $190k to $210k per year. The histogram above shows the ranges for publicly traded SaaS companies.
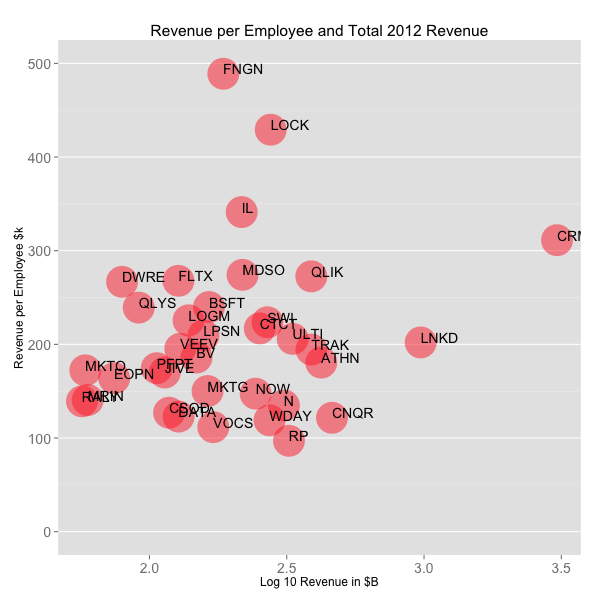
In the scatterplot above, which compares revenue per employee to revenues (in log10 scale), the outliers pop out. Financial Engines (FNGN) is the most efficient publicly traded SaaS company at $500k in revenue per employee and LifeLock isn’t far behind. Salesforce (CRM) and LinkedIn (LNKD) are much closer to the average range while other darlings like WorkDay (WDAY) and Tableau (DATA) are close to $100k.
Revenue per employee isn’t a leading indicator of success, but a lagging one. It’s also a composite metric that is negatively impacted by significant waves of hiring, sales team ramp time, product and company maturity in a market and many other factors. Notably, there isn’t much of a correlation between the revenue per employee and total revenues (R^2 of 0.2) or market cap (R^2 of 0.06), so revenue per employee doesn’t seem to limit the growth of company or hamper valuation.
All of this means revenue per employee isn’t a metric to optimize for. Rather it’s a helpful as broad benchmark of the general efficiency of a business and a place to start analyzing employee productivity if a business deviates too much from the comparables.