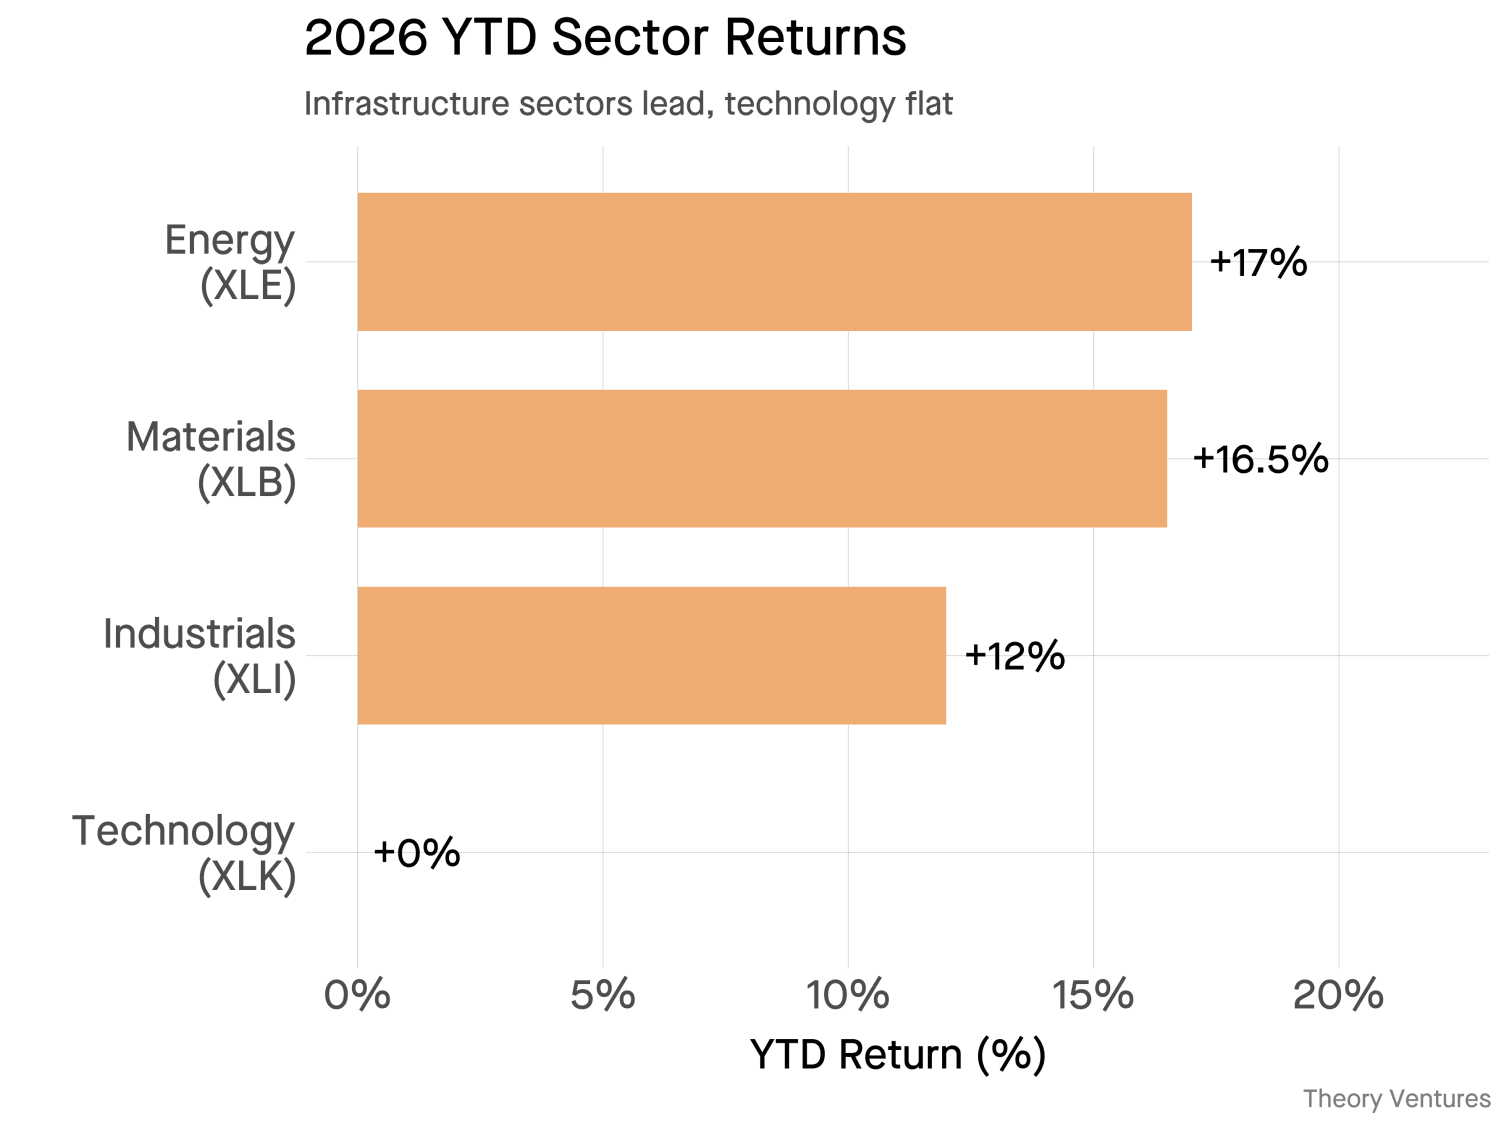
Energy is up 17% this year. Materials 16.5%. Industrials 12%. Technology is flat.
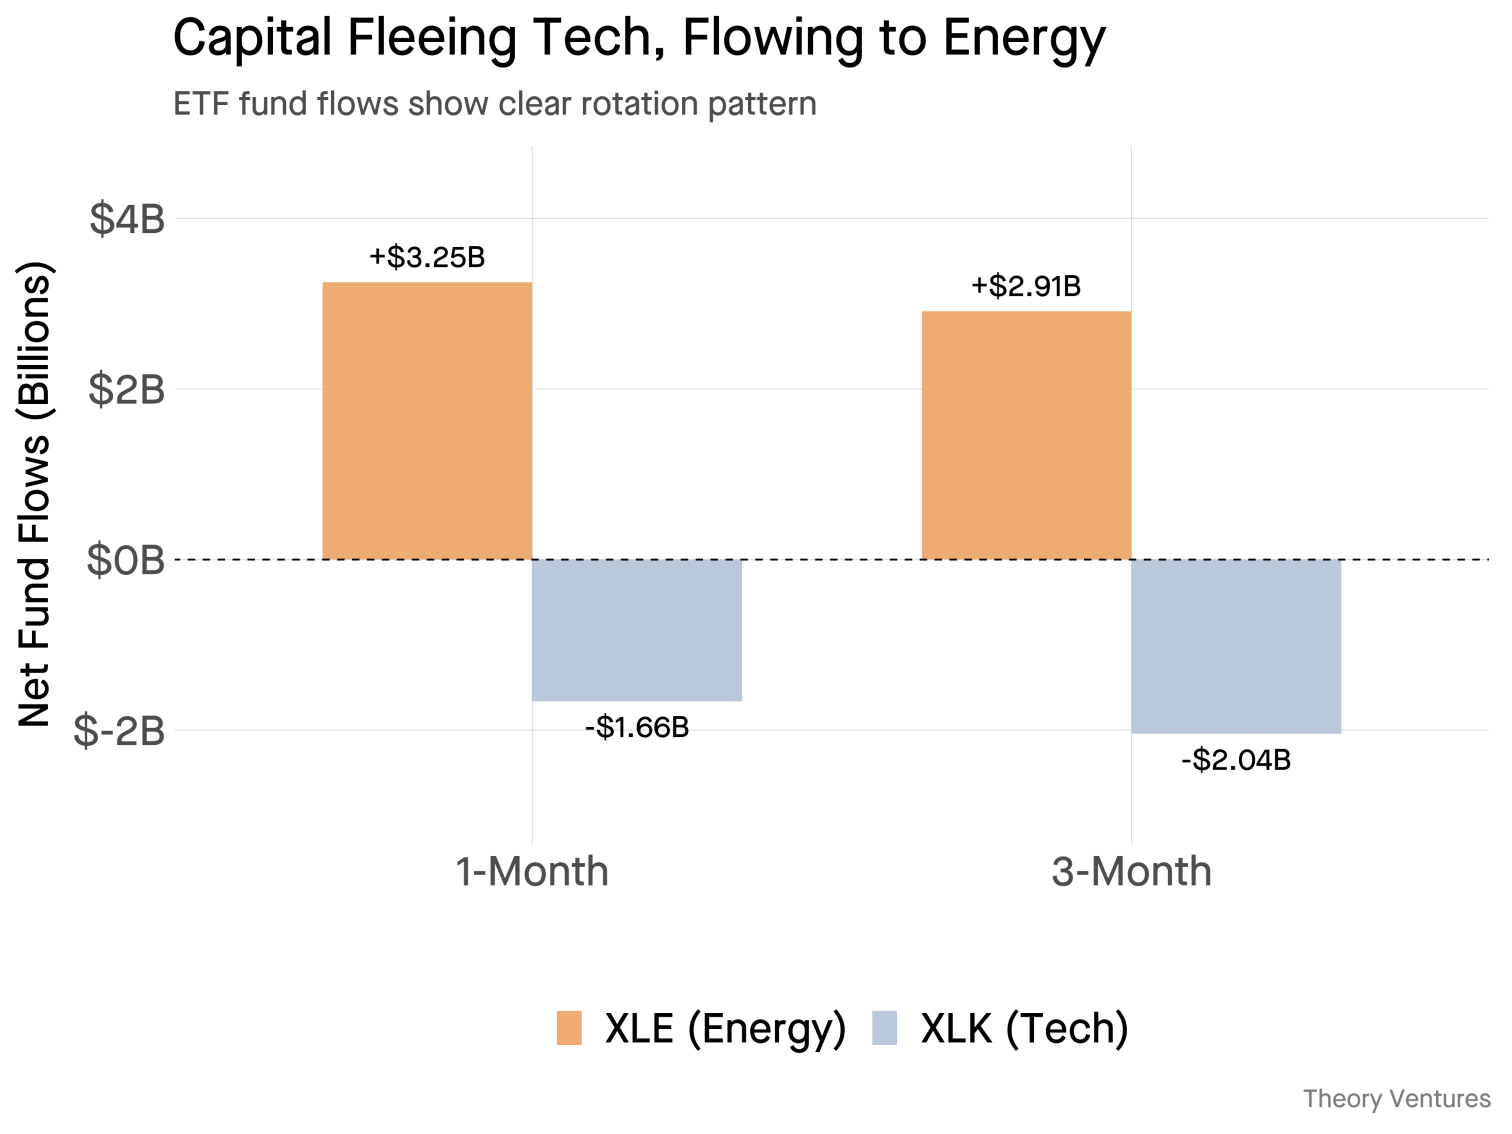
Over the past month, $3.25 billion moved into XLE (energy) while $1.66 billion left XLK (tech).1
The logic isn’t obvious until you look at operating leverage.
| Sector | P/E | Rev Growth | Earnings Growth | Dividend | Leverage |
|---|---|---|---|---|---|
| Technology (XLK) | 32x | 19% | 18% | 0.7% | 1.0x |
| Energy (XLE) | 21x | 5% | 16% | 3.1% | 3.0x |
| Materials (XLB) | 34x | 8% | 17% | 1.3% | 2.2x |
| Industrials (XLI) | 39x | 8% | 14% | 1.8% | 1.9x |
Energy’s 5% revenue growth becomes 16% earnings growth through 3x operating leverage. The sector trades at 21x versus tech’s 32x, while paying a 3% dividend yield that cushions downside.2
The asymmetry matters. If tech misses estimates by 5 points, the 32x multiple contracts. If energy misses by 5 points, dividends cushion the fall. One has a trapdoor. The other has a floor.
Hyperscalers will spend $600 billion on infrastructure in 2026.3 Data centers already consume 4% of US electricity. By 2028, that share could reach 12%.4
The bet has risks. Energy at 21x P/E isn’t cheap by historical standards, it’s expensive. The sector typically trades at 10-15x. Grid buildouts face 3-year transformer lead times & 10-year permitting cycles. If AI monetization disappoints, hyperscalers will cut capex as fast as they deployed it. Ask anyone who held fiber stocks in 2001.
In 2026, the market is betting on hard infrastructure.
-
ETFdb Fund Flows, February 2026 ↩︎
-
Correction (Feb 14, 2026) : The original version of this post added dividend yield to earnings growth to estimate “total return potential.” This was methodologically incorrect—dividends are paid from earnings, not in addition to them. The corrected version presents valuation (P/E) and dividend yield as separate considerations. ↩︎
-
IEEE ComSoc, December 2025 ↩︎
-
DOE Data Center Report, 2025 ↩︎