
I started working in venture capital three months before Lehman imploded. After the bankruptcy, the fundraising market contracted as investors internalized the new normal of the public markets. Over the past six years, the fundraising markets flipped from quite bearish to mildly bullish to extremely bullish. Or at least, that’s the way it feels to me.
I’ve often struggled to convey the magnitude of the change and its unevenness. So I thought I could do it with data. Above, I’ve plotted the mean and median investment amounts for Series As, Bs, and Cs from 2006 to through September of 2014 in the US, as reported by Crunchbase data.
The data reveals three trends. First, the Series A market has remained stable throughout the eight year period. In fact, the median Series A in 2006 equals the median in 2014: $5M.
Second, Series C sizes have ballooned. The median C round is 2014 is twice as large as the median 2009. Series Bs grew by 60% in the same period.
Third the difference between the mean and the median also has become greater in later stage rounds. The Series C mean differs from the median has increased by 160%. Series A, only about 14%. We’ll explore the causes of this trend by examining the fundraising patterns by quartile.
Before we do, let’s look at a summary table of the data. The table below shows the Median Compound Annual Growth Rate (CAGR) of round sizes from 2006 to September 2014, the 75% Percentile CAGR, the total percentage change in median round size since 2006 and the median round size in 2014.
| Round | Median CAGR | 75th Percentile CAGR | Change since '06 | Median in '14 |
|---|---|---|---|---|
| A | 2.0% | 1.0% | 6.7% | 6.3 |
| B | 3.6% | 5.2% | 42.9% | 15.9 |
| C | 7.4% | 8.4% | 75.7% | 26.2 |
When looking at median CAGR over this eight year period, inflation becomes an important consideration. The consumer price index (CPI), a measure of inflation, grew at 2.1% annually, implying Series A sizes are growing at the rate of inflation. Meanwhile Series Bs are growing slightly faster and Series Cs have been experiencing much faster growth.
Comparing the Median CAGR to the 75th Percentile CAGR, we can see that most Series A sizes have grown slower than inflation. Meanwhile, top Series B and Series C companies’ round sizes are growing faster than the median.
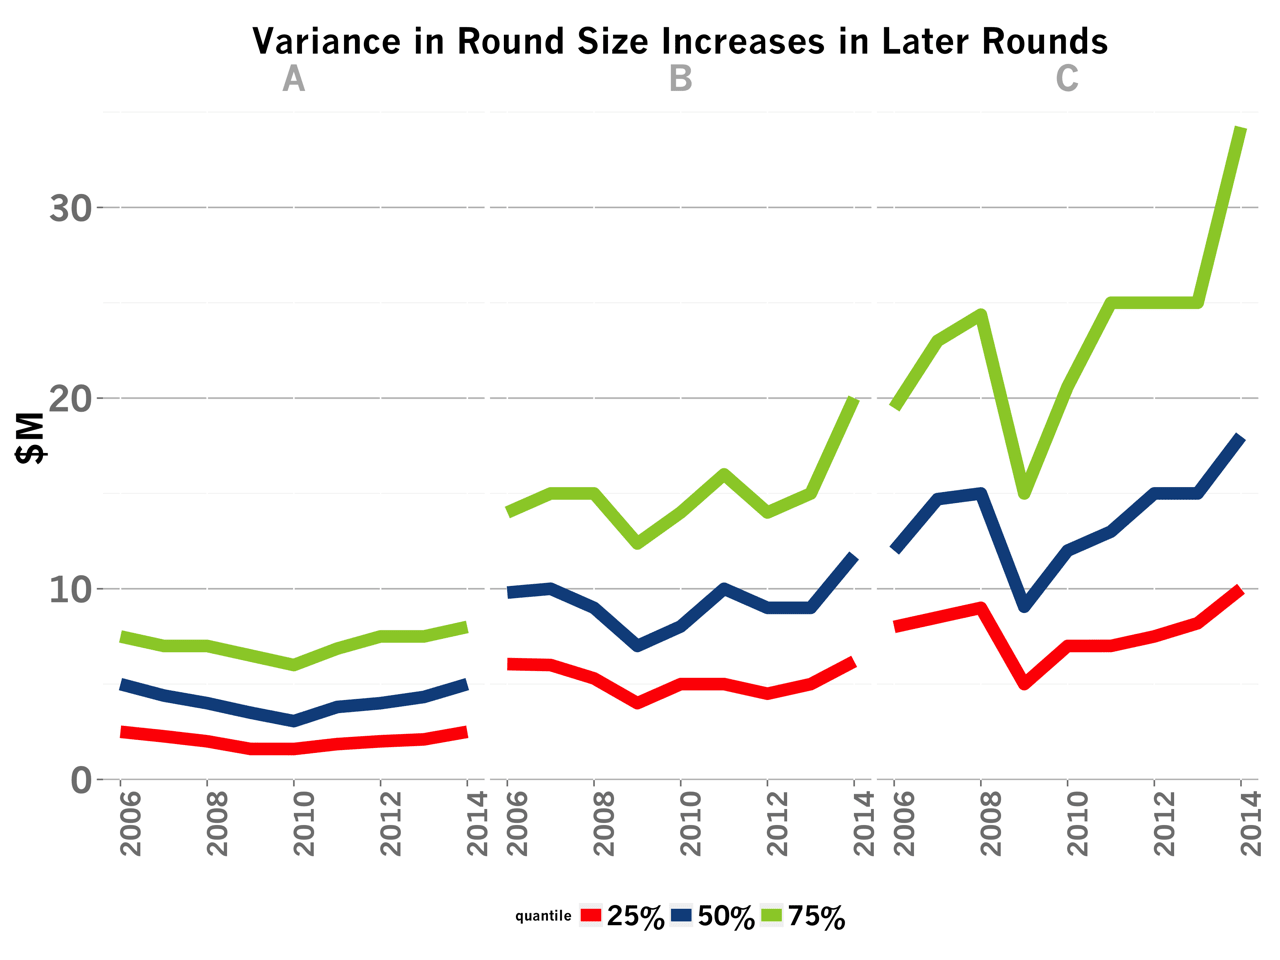
Here’s the data plotted to provide a better sense of the trends. I’ve plotted above the 25th, 50th and 75th quartiles for each of the rounds over the same eight year period.
The 75th percentile Series A companies raise as much today as eight years ago. But in the Series B, this cohort raises 25% more and in the Series C, 75% more. These trends are similar but muted for the 50th percentile startups and flat for the 25th percentile companies.
The amount of capital raised by VCs in 2014 is on track to double the capital raised in 2013. This data indicates this additional capital seems doesn’t inflate Series As. Rather, startups with momentum in the Series B and in particular, the Series C, are able to raise substantially larger rounds than in the past.
The fundraising market’s evolution from bear to bull has been rapid and uneven. Individual Series A companies don’t benefit in the form of larger round sizes nearly as much from the flood of venture capital as later stage companies do. But they do benefit from an increasing number of Series As.

As the chart above shows, the share of investment dollars in Series As has increased by at least 50% from about 30% to about 60% in the same time period.
Meanwhile, the total number of Series Bs and Series Cs has fallen during the same period, but the companies that do raise command twice the capital as before.