Several weeks ago, I wrote a post about the Optimal Contract Value for a SaaS company. I wondered whether startups serving enterprises might be more or less valuable than those serving small-to-medium businesses (SMBs). Interestingly, the data showed there was no optimal customer value to build a publicly traded SaaS company.
Having written that post, I began to wonder about other differences between different types of SaaS companies. In particular, do SaaS startups serving SMBs spend more or less than their counterparts in the mid-market and enterprise? And which type of SaaS startup grows the fastest?
To answer those questions, I’ve pulled together data from a basket of 46 publicly traded SaaS/Cloud companies and segmented them based on their average annual customer value (ACV) into three buckets: SMB (<$10k), Midmarket, (>=$10k to < $100k) and Enterprise (>$100k).
Below I’ve charted the median trends of these companies as they progress from their founding over the next ten years. These four charts contrast sales & marketing investments and revenue growth trends across the three different SaaS startup segments.

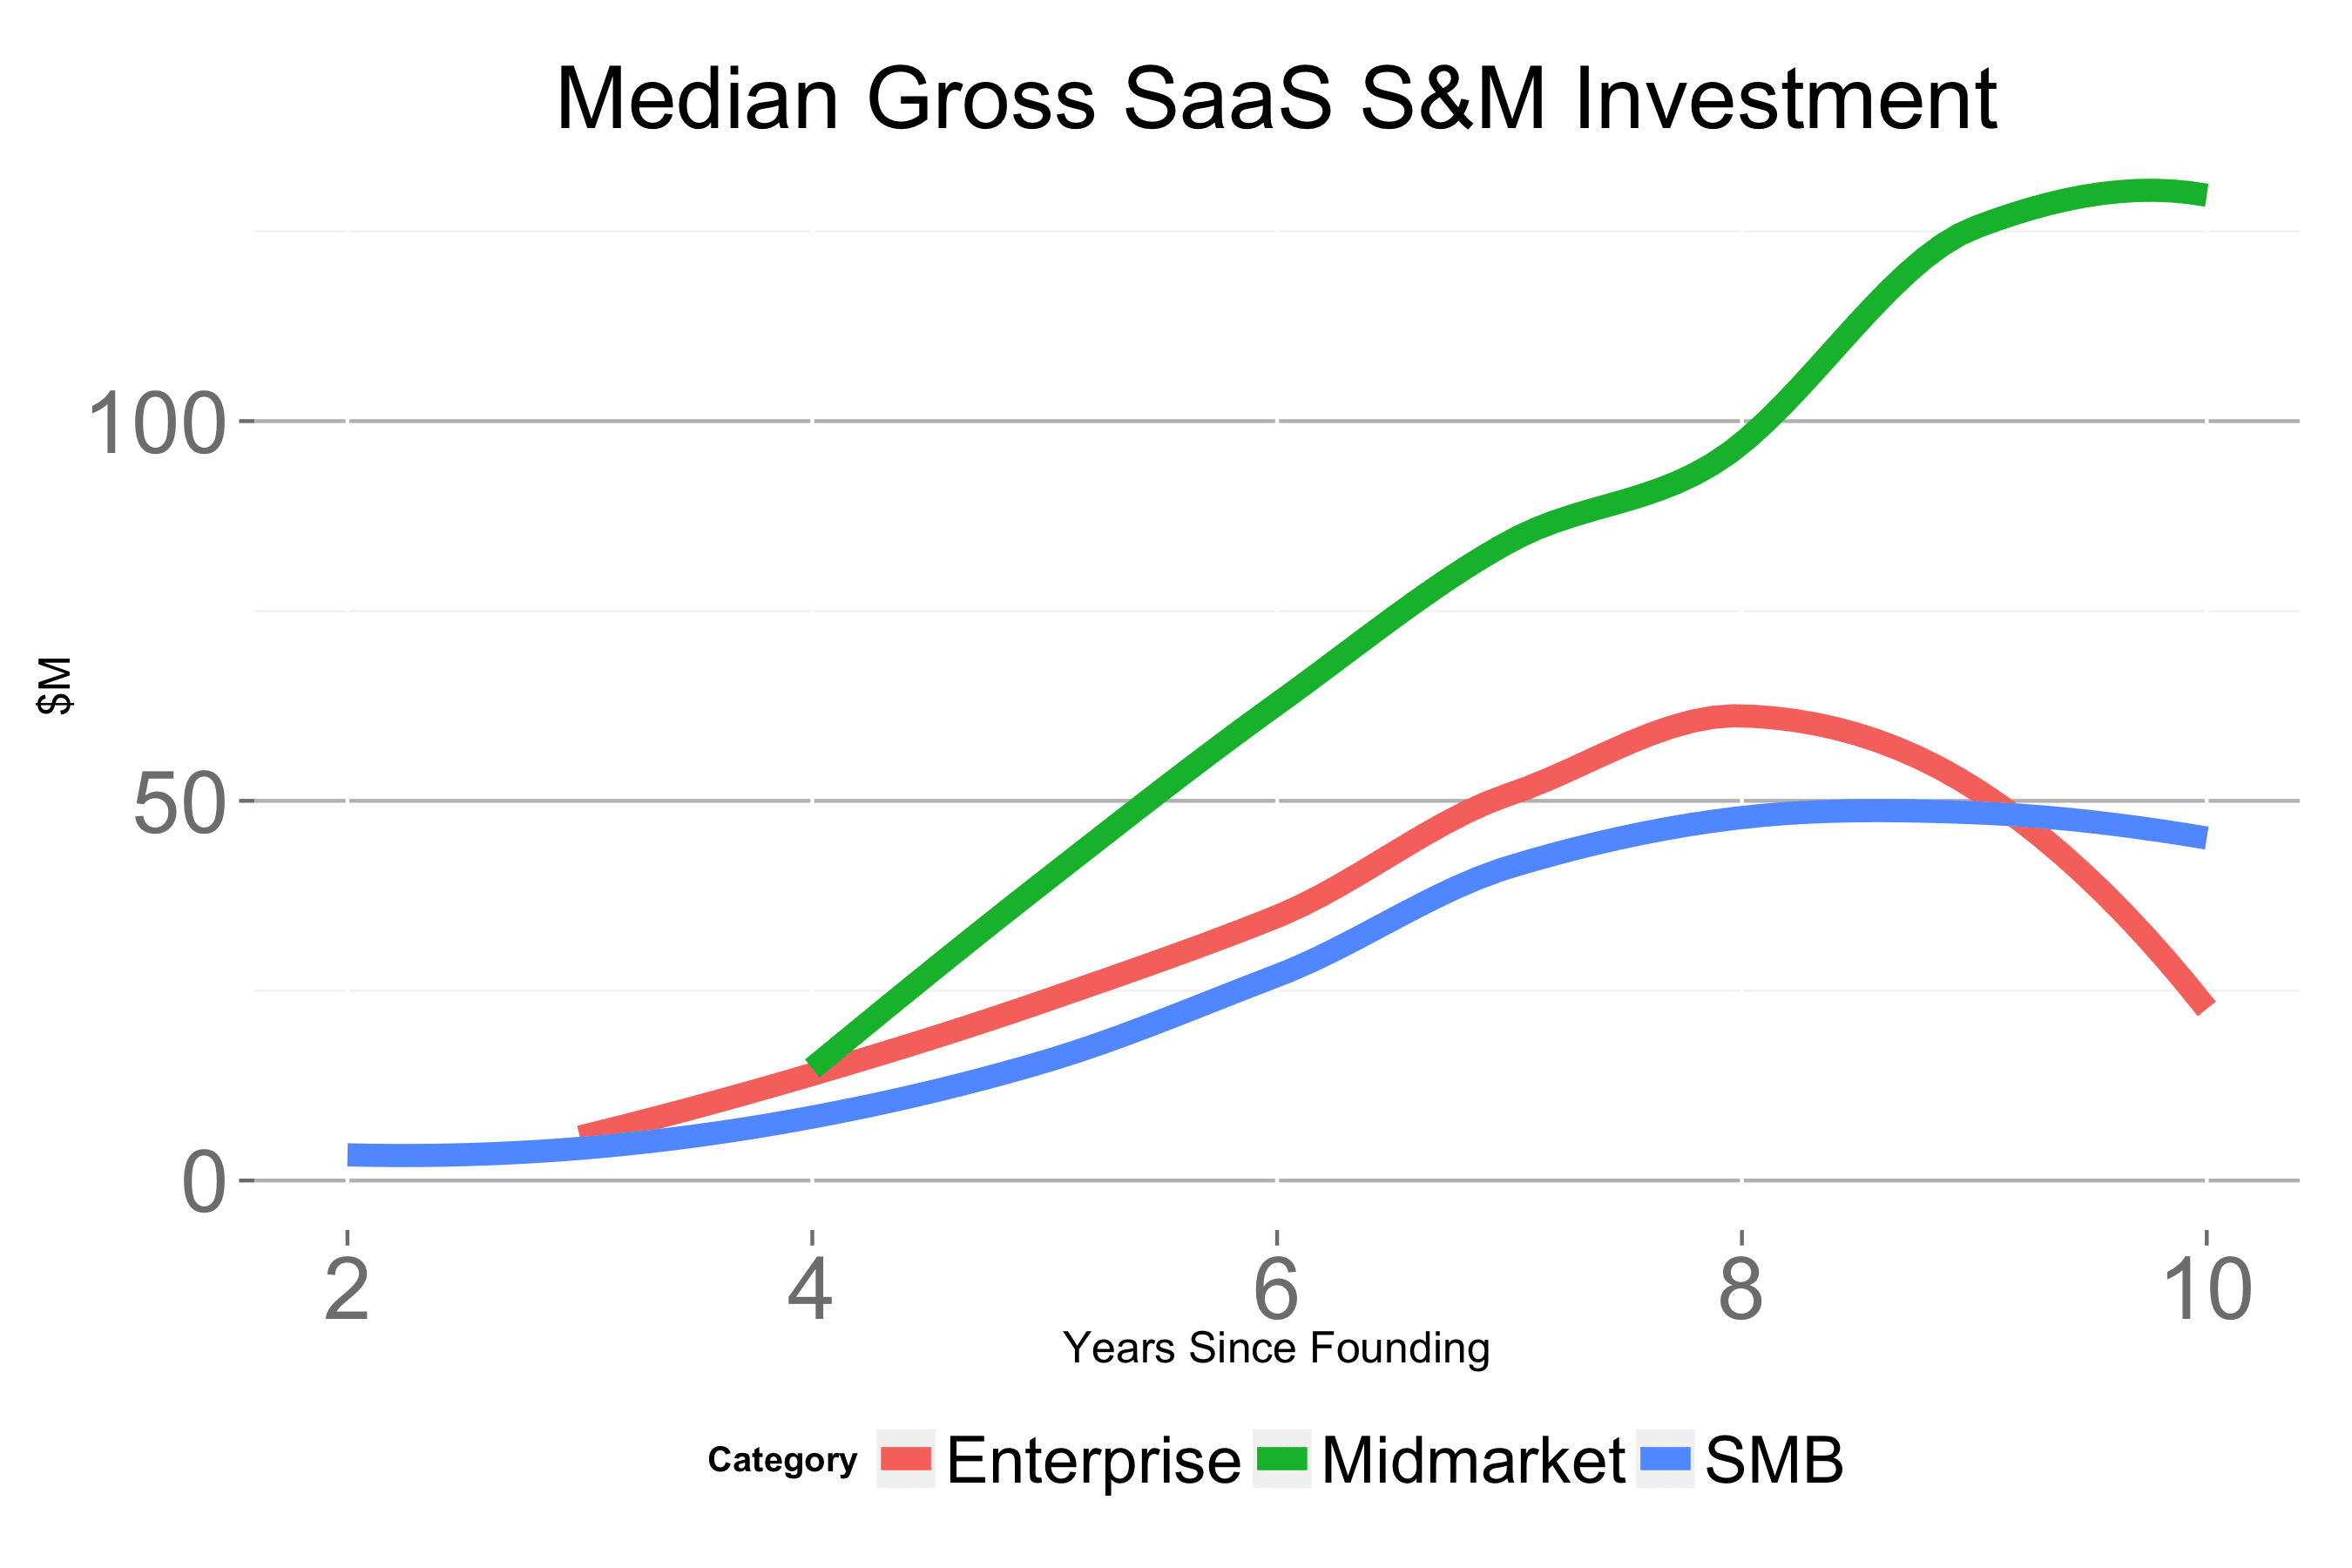
The chart above depicts the Sales & Marketing (S&M) spend across the three segments. The median SMB SaaS startup spends significantly less on sales and marketing through year 4 of their lives. Presumably, these startups are driven to find more cost-effective means of customer acquisition, like freemium, because the smaller ACVs can’t accommodate larger cost-of-customer acquisition. As the company’s revenue grows, however, SMB companies’ S&M expenditure converges with Midmarket and Enterprise companies.
The mid-market and enterprise companies can afford to hire large sales and marketing teams to acquire customers and spend statistically identical amounts on sales and marketing throughout.
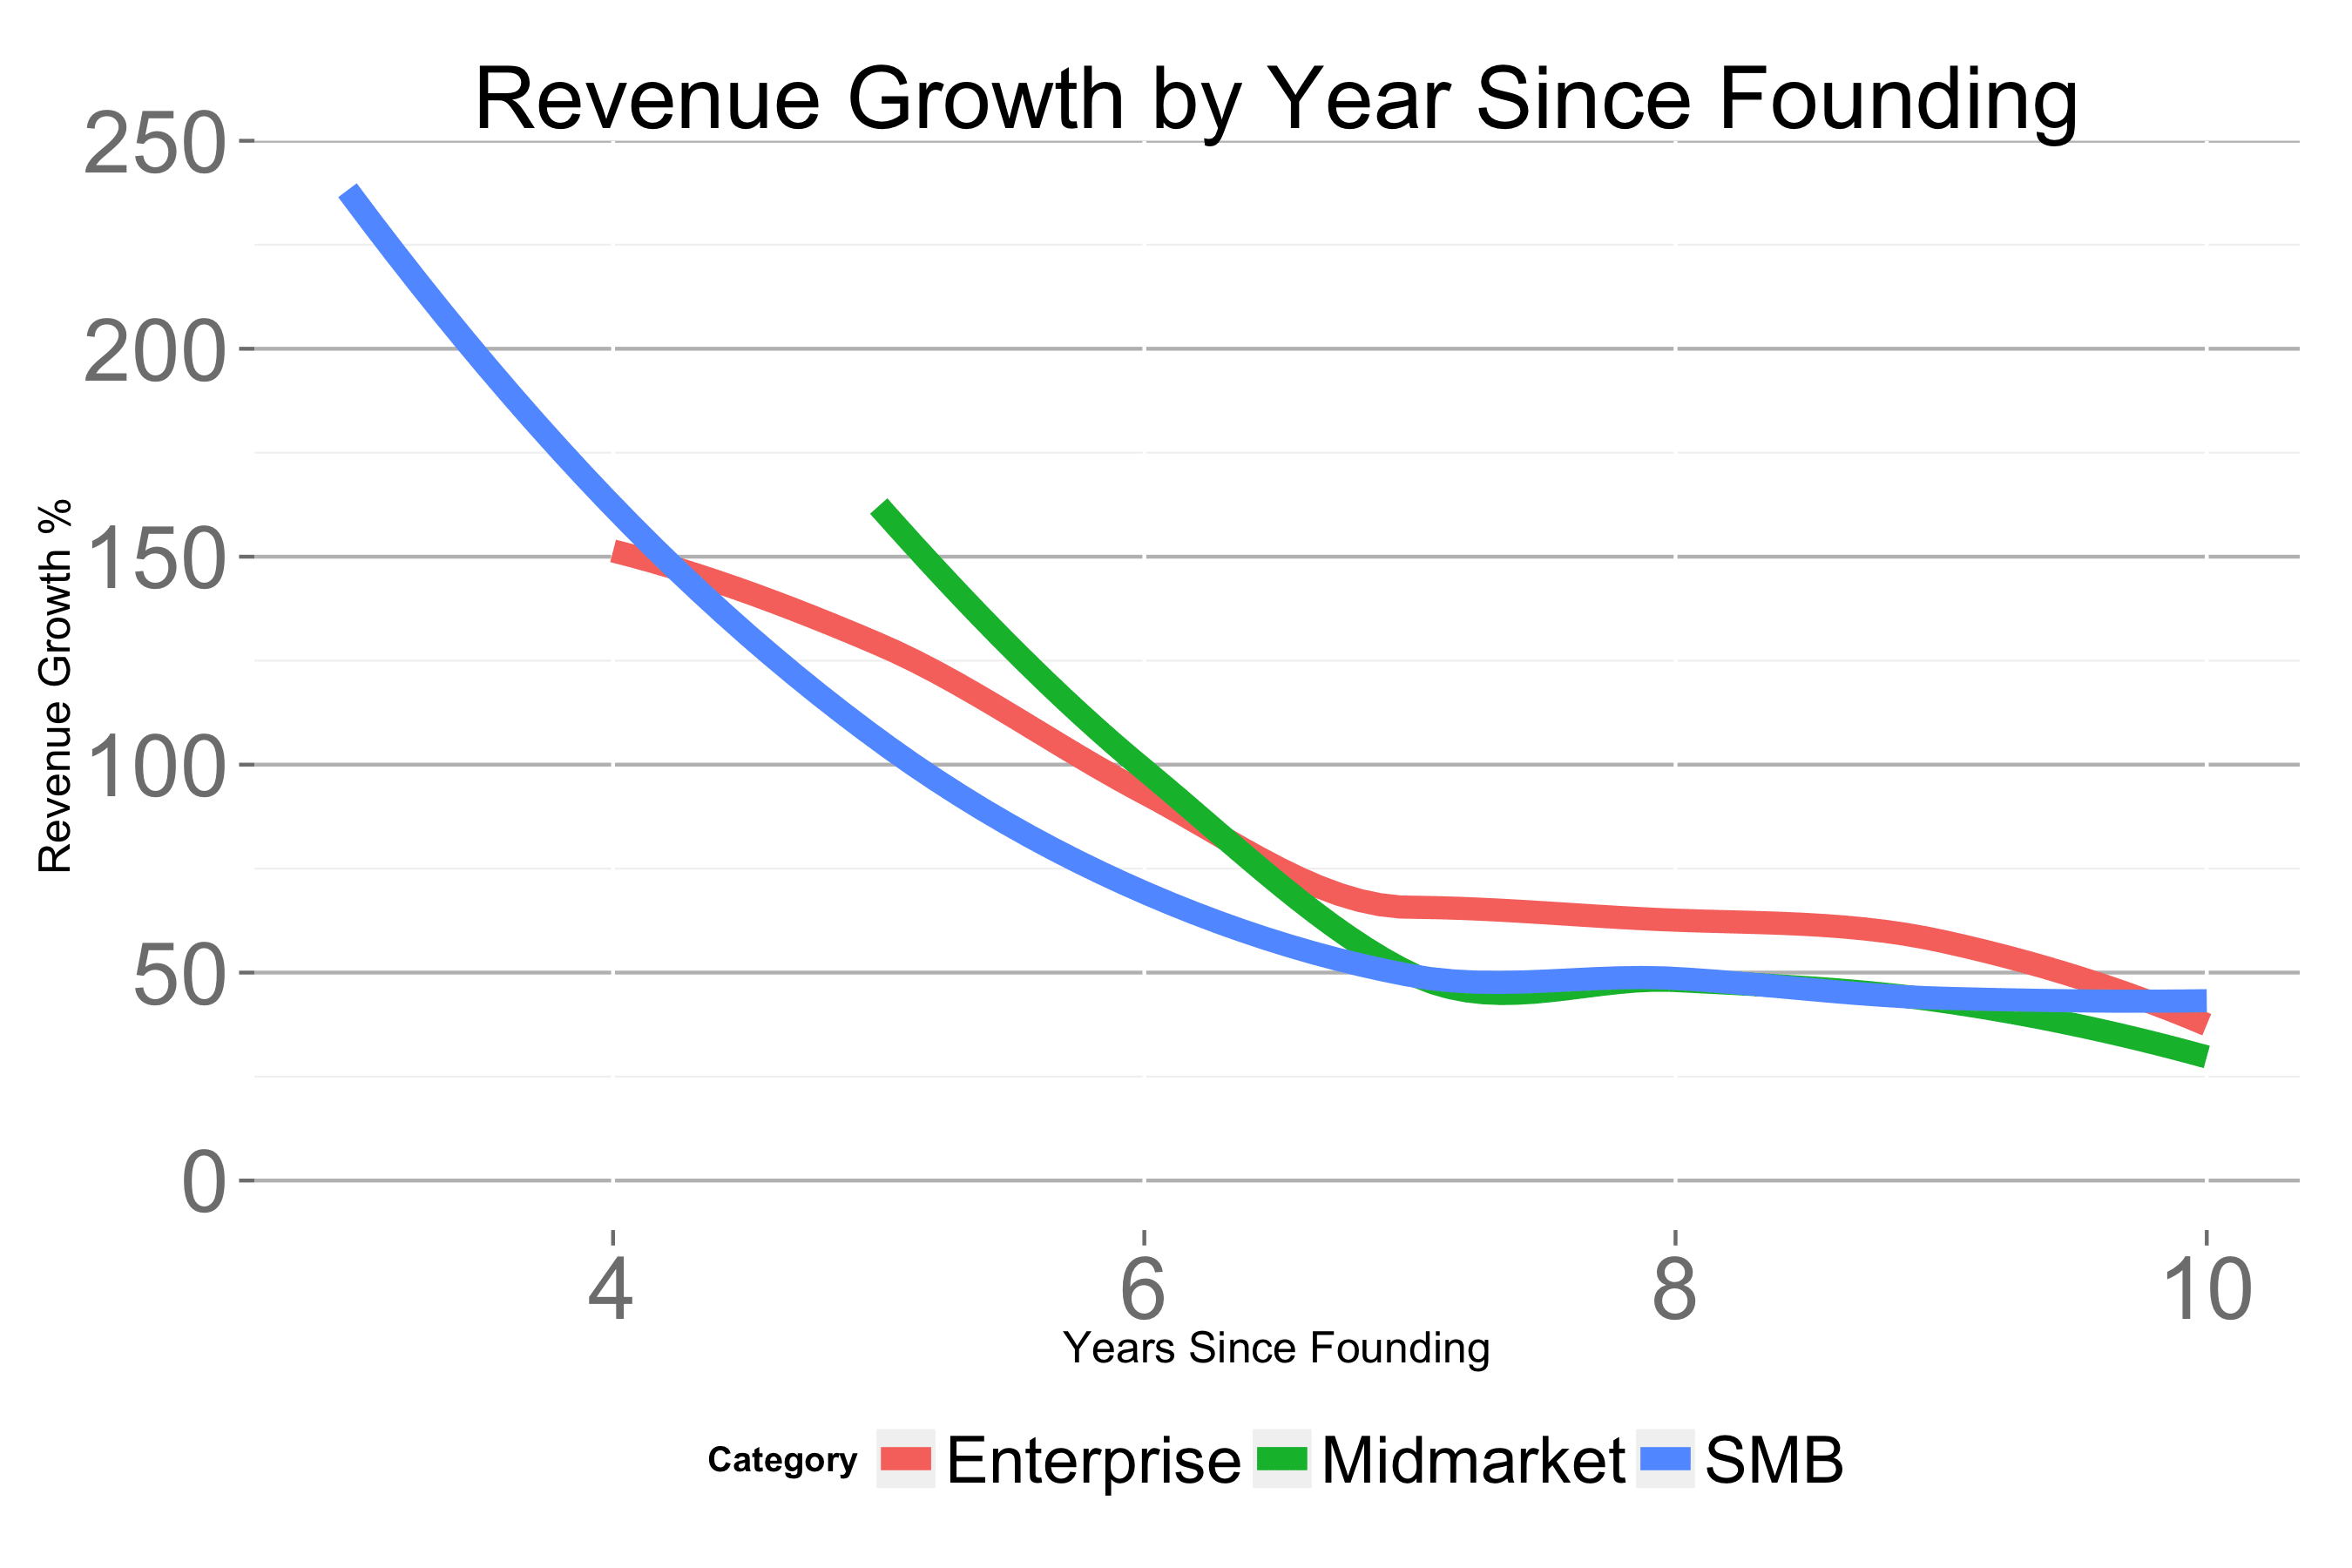
The next most important question, of course, is how those sales & marketing investments translate into revenue growth. The chart above shows that despite the important differences in sales and marketing spend, the SMB companies in the dataset (who have been successful enough to IPO), have sustained equivalent revenue growth rates to their sales-team-driven brethren. Presumably, these SMBs SaaS startups found a scalable customer acquisition channel that either complemented or wholly replaced the sales and marketing teams in the early days.
If you’re curious about the median gross S&M spend by segment, the chart above shows that. And the chart below plots the median revenue by segment. These two charts do show one counterintuitive trend: Midmarket SaaS startups tend to generate more revenue than either SMBs or Enterprise.
In Segmenting the SaaS Market for Sales Success, we showed that the number of employees in very small, medium and very large companies is roughly equal. So, for a startup pricing per seat, the market opportunity is equivalent. But the substantially larger revenues of Midmarket companies shows that these companies are able to penetrate their market more deeply and ultimately capture more revenue. Perhaps these companies strike the best balance between large enough ACVs to justify sales investment and minimize the customization often required of large enterprise software: this powerful combination minimizes sales costs while accelerating sales velocity. Or so the data suggests.

It’s important to note that the dataset I’ve used is quite small and the number of data points on any given year for a given segment number no more than 10. This means that for most of the comparisons, there is no statistically significant difference between the data of SMB, Midmarket and Enterprise companies’ sales & marketing investments or revenue growth, which is itself an interesting conclusion. There is only one exception to this: the S&M expenditure of SMB SaaS companies is significantly lower in their early years than in other segments.
Also, these benchmarks are medians and they mask the variance across companies. Each of these companies pursued unique approaches in the market that enabled them to become leaders in their field and the aggregate statistics will never be able to communicate those unique stories.
Thanks to Dan Siroker who inspired this post.