Private equity firms have emerged as the newest distribution channel for AI startups.
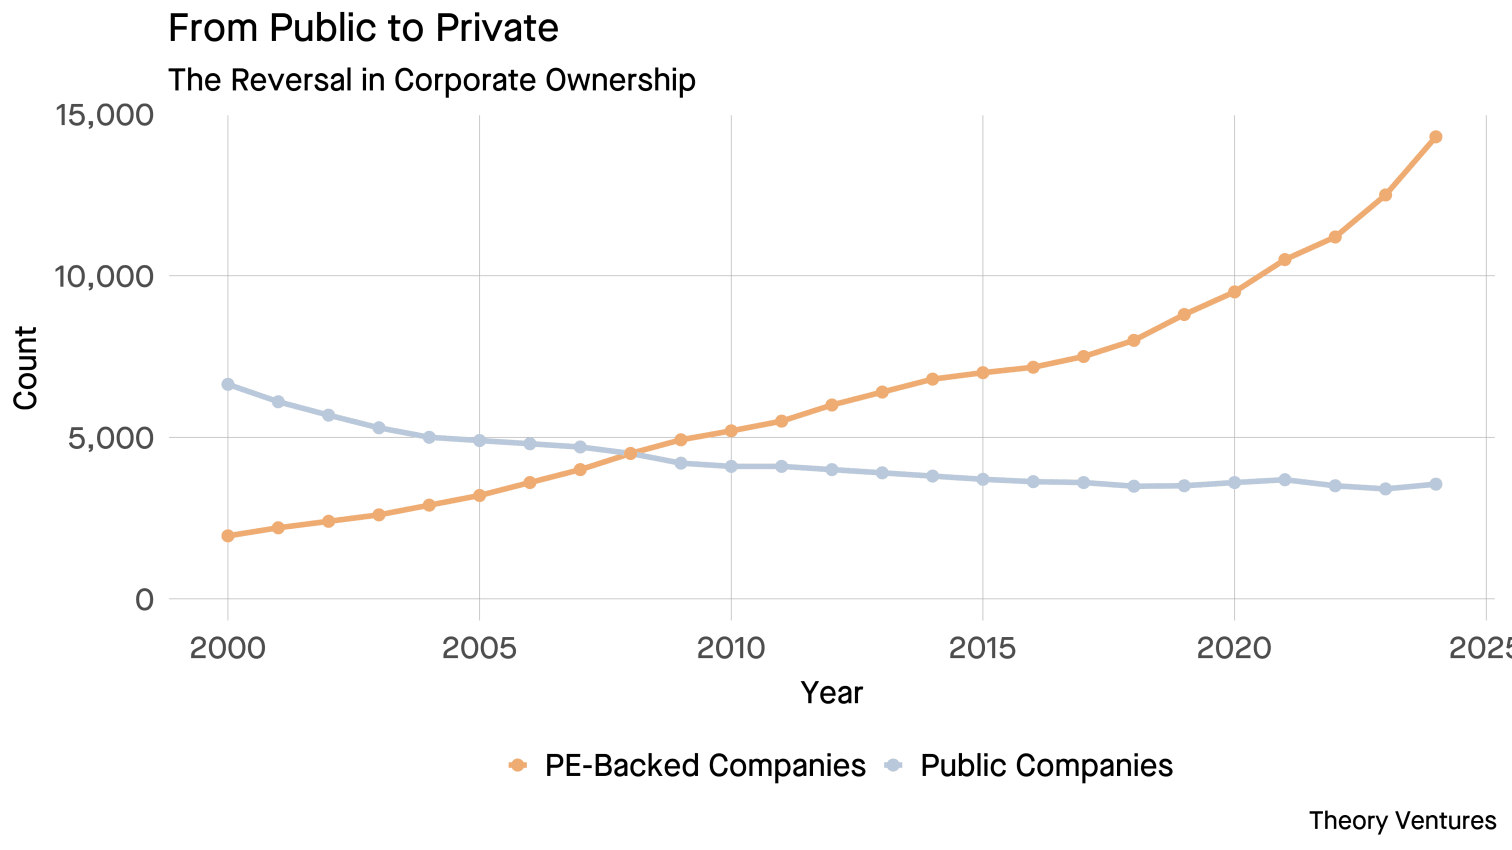
While public companies have decreased from 6,639 in 2000 to 3,550 in 2024, PE-owned companies in the US have grown from 1,950 to 14,300. The rate of growth continues to accelerate.
The crossover happened in 2009, when PE inventory overtook public company counts for the first time. By 2024, PE-backed companies outnumber public firms by roughly 4:1.
The shift is driven by the massive expansion of PE ownership across corporate America.
That’s not to say the sizes of PE-owned companies are the same as publics. In fact, they are smaller.
The point isn’t that startups previously focused on public companies. Rather, the data reveals the immense scale of private equity portfolios.
| Metric | Public Companies | PE-Backed Companies |
|---|---|---|
| Revenue Growth (CAGR) | 5.4% | 7.0% |
| Typical Headcount | >3,000 | <500 |
Data Sources : CRSP1, Wilshire 50002, PitchBook3, American Investment Council4, Citizens Bank5.
The mid-market profile of these PE-owned companies suits AI startups’ desires for faster sales cycles.
Plus, the profit motive of private equity aligns perfectly with AI startups’ capacity to cut costs & drive efficiency. PE firms acquire companies to improve margins & operational performance before exit.
AI tools that reduce headcount, automate processes, or accelerate workflows deliver exactly what PE operating partners need.
A private equity firm owning 25 companies proves value in one or two before rolling out to the entire portfolio. Control enables rapid deployment. This creates an efficient channel for AI startups to demonstrate value & cross-sell.
PE firms gain operational leverage while AI startups access more than 14,000 motivated buyers. This new go-to-market motion redefines how AI software reaches the market, bypassing the traditional enterprise sales grind in favor of networks that can deploy at scale.
-
CRSP Count™ tracks quarterly changes in publicly listed domestic operating companies. ↩︎
-
Wilshire 5000 Total Market Index historical component counts. ↩︎
-
PitchBook 2024 Annual US PE Breakdown provides private equity portfolio company statistics. ↩︎
-
American Investment Council quarterly research reports on PE trends, employment & portfolio companies. ↩︎
-
Citizens Bank PE survey data on private equity market composition. ↩︎