---
title: "Surprising Trends in Startup Founder Equity Stakes"
description: "Discover how founder equity stakes have evolved: CEOs now retain 30-33% more equity through Series A/B rounds, based on analysis of 200+ startups per year."
categories: ["startups","compensation","data analysis"]
keywords: ["founder equity","startup compensation","venture capital","Series A funding","Series B funding","Tomasz Tunguz","equity stakes","startup trends"]
ai_summary: "Founders are retaining 30-33% more equity during Series A/B rounds compared to four years ago, impacting startup dynamics."
date: 2014-05-02
lastmod: 2026-07-23
canonical_url: https://www.tomtunguz.com/trends-in-founder-compensation/
author: "Tomasz Tunguz"
---
Earlier this week, I wrote about the [increase in cash compensation and decline in equity grants to VPs of Engineering and Product in startups](http://tomtunguz.com/vpe-vpp-compensation-trends/). I received a lot of comments about the analysis, and in particular hypotheses to explain the data. I dug a bit deeper into the data set to find an explanation.
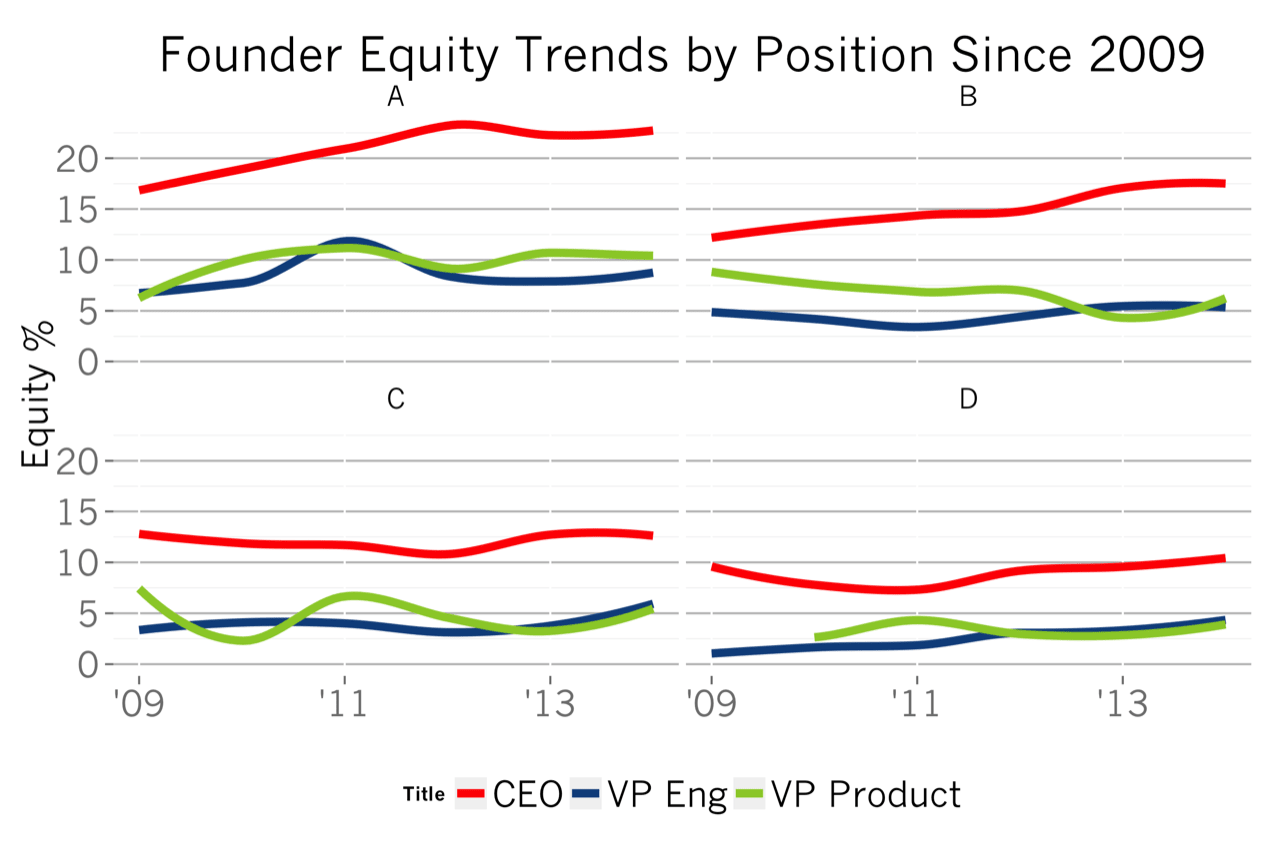
Founding employees keep more equity today than ever through the Series A and Series B. On average, founders retain 30-33% more equity than 4 years ago through those first two rounds of institutional investment. For the statisticians out there, this change is statistically significant with greater than 99% confidence on an average yearly sample size about 200+ data points per year per role.
The chart above shows the trends in four graphs. The graphs are broken out by last Series of investment (A, B, C and D) and show the equity compensation trends of CEOs, VP of Engineering and VP of Product. The gray shadows around the lines represent the 95% confidence intervals.
In 2014, the median founding CEO equity stake after raising a Series A is 21% up from 15% in 2009. The trend is similar for Series B companies. On the whole, the founder stakes for founding VPEng and VPProduct have remained relatively stable. The much higher variances of equity stakes for these two positions make it difficult to draw a statistically significant conclusion about trends.
Let's compare founder equity trends with non-founders, in the chart below.
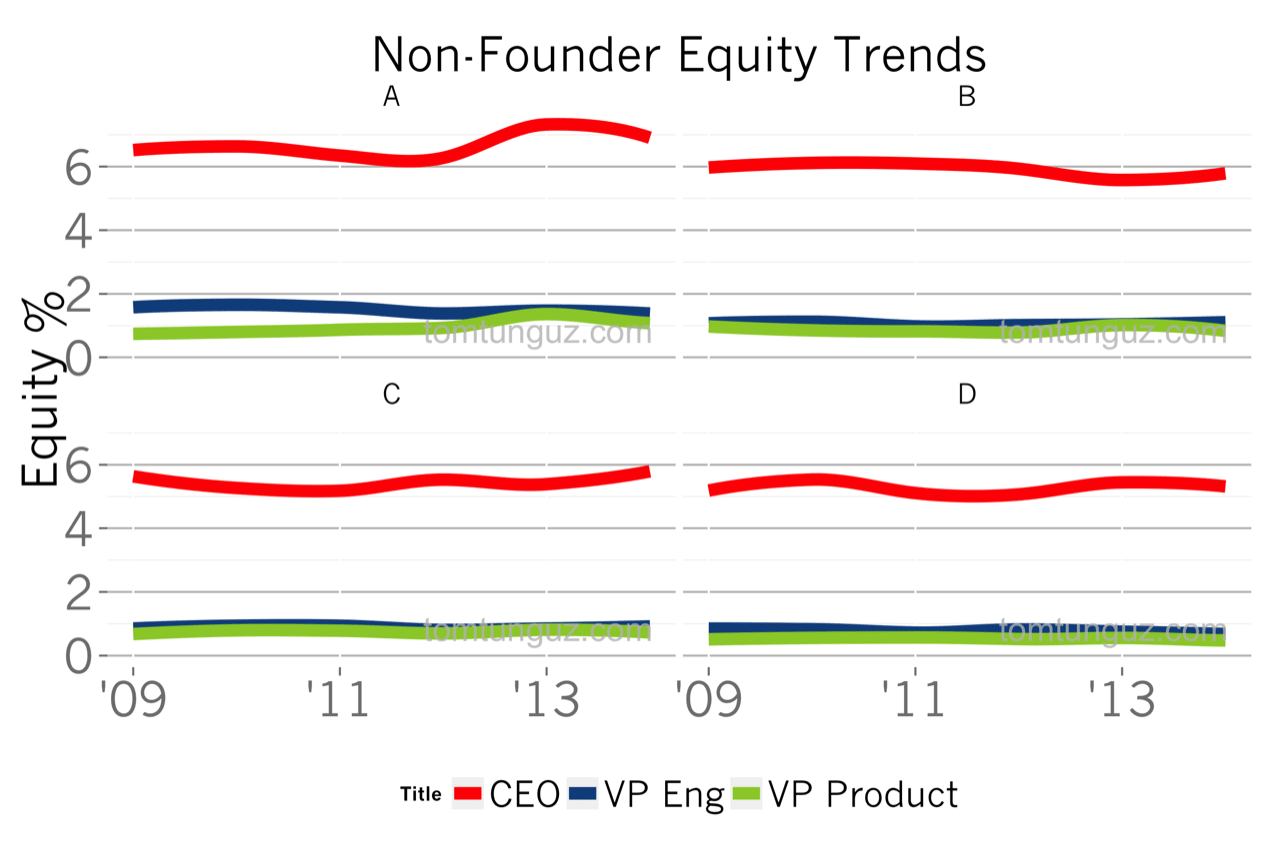
Non-founder equity grants have remained relatively constant over time, with a recent spike in post-Series A CEO compensation apparent in the last year.
If the capitalization table of a startup has 100%, and the compensation for founders is increasing and the compensation for non-founders is staying constant, whose share is contracting?
Venture capitalists.
[Pitchbook's Q4 Series A and B valuation data](http://pitchbook.com/download.html?id=4Q2013_VC_Valuations_and_Trends_Report&key=yaNqxiUf3R13jaw7), copied below, shows a greater than 44% increase in median startup valuations during the same time period as the compensation study above. But Crunchbase data indicates that round sizes have remained relatively constant.
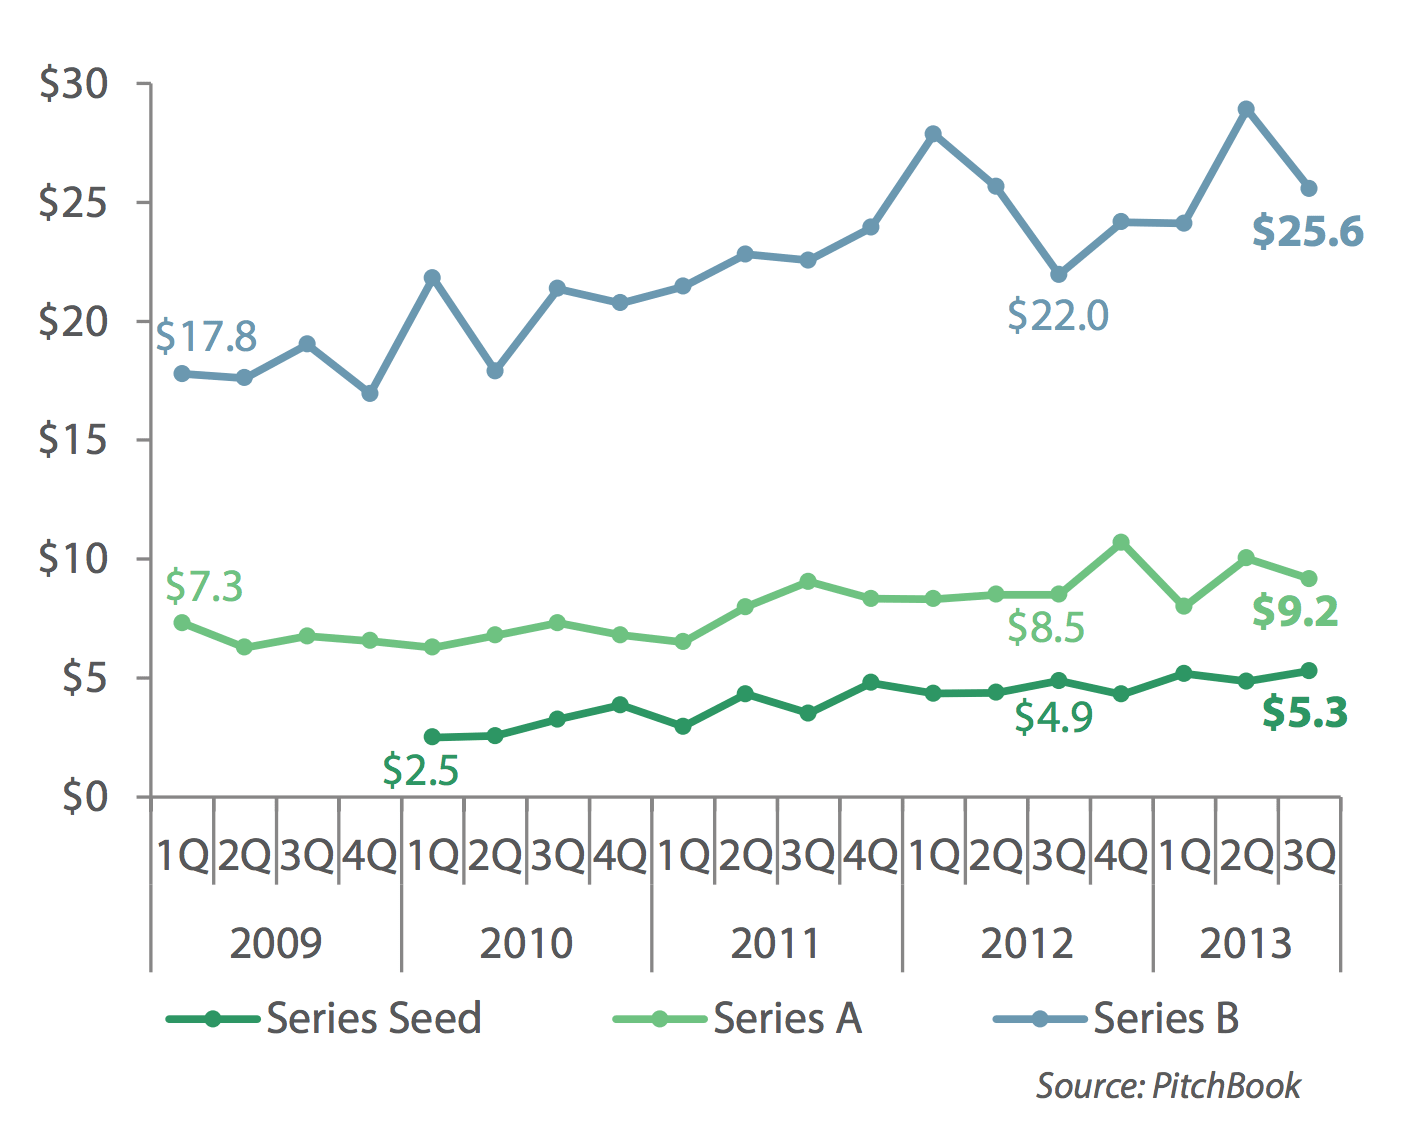
So, on the whole, as valuations in startupland have increased, investors have held their check size relatively constant and consequently, founders are retaining more equity in their businesses.