Over the weekend, I analyzed my Twitter performance over the past 4 weeks. I wanted to determine what if any best practices I could tease from the data. Below are my four conclusions:
On average, tweets at 9am generate 2.3 times the number of clicks as those in the 8am hour and 3.3 times those of the 12pm (lunch) hour. Below is a chart of number of clicks per tweet by hour of the day: 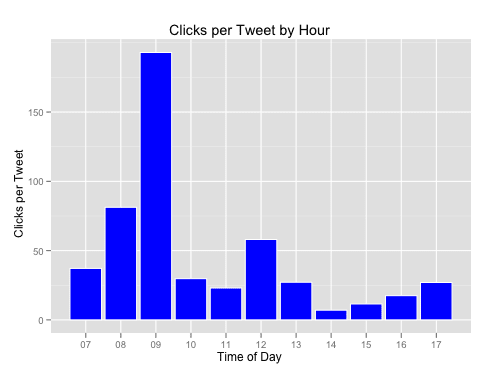
My median tweet receives 24 clicks and the average tweet receives 36 clicks. So the first retweet drives a 25 to 33% increase in clicks. Below is a chart of tweets (marked by red dots) plotted by the number of reactions/retweets and clicks. The blue line is the linear trendline.
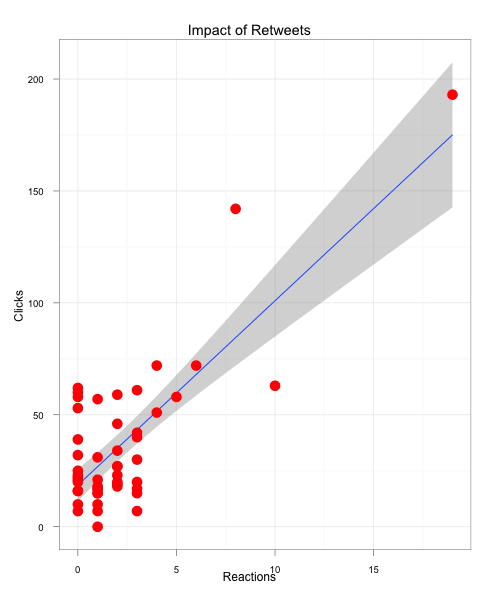There is a step function apparent in the data. If one of my tweets is retweeted by @hnshah with 80k followers, I instantly receive twice the clicks. The chart below plots the reach of each tweet by the number of clicks.
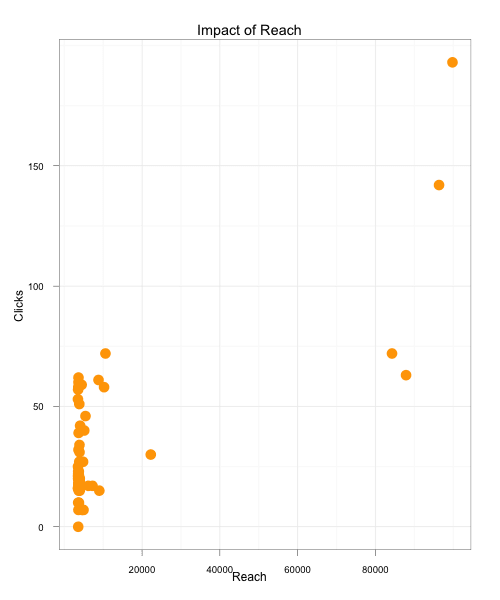I use timely.is to programmatically send tweets out at the optimal times of the day. You can see from this analysis that tools like these don’t seem to provide much value aside from scheduling.
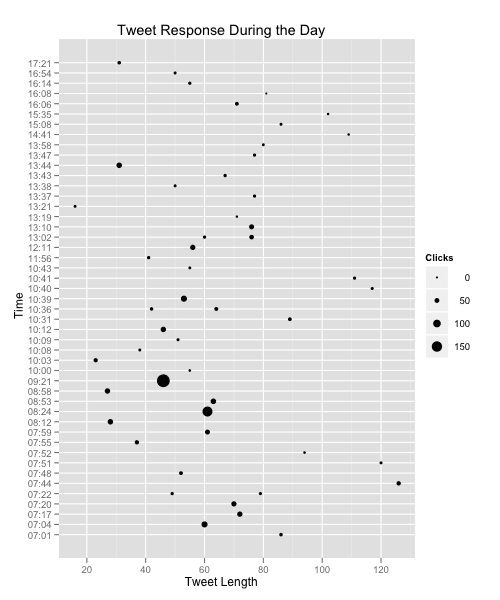
Below is a chart of tweets by time of day (y-axis) and tweet length (x-axis) with the number of clicks indicated by the size of the bubble. My most successful tweet generated about 190 clicks. It was sent at 9:21 am and had 46 characters. NB: I don’t send many long tweets, so there is a data bias.
Below are stats describing my tweets in a bit more detail. The key conclusion is that the upper bound outliers, the really successful tweets, skew averages much higher than medians - this is the viral effect in action.
| Clicks | Reach | Retweets | Tweet Length | |
| Average | 37 | 11,882 | 2 | 65 |
| Median | 24 | 3825 | 1 | 61 |