3 minute read / Jan 4, 2022 /
The Top Sectors of Web3 in 2022 by Revenue
With the summer of Defi behind us and a new year for web3, I wondered which categories of web3 startups generate the most revenue.
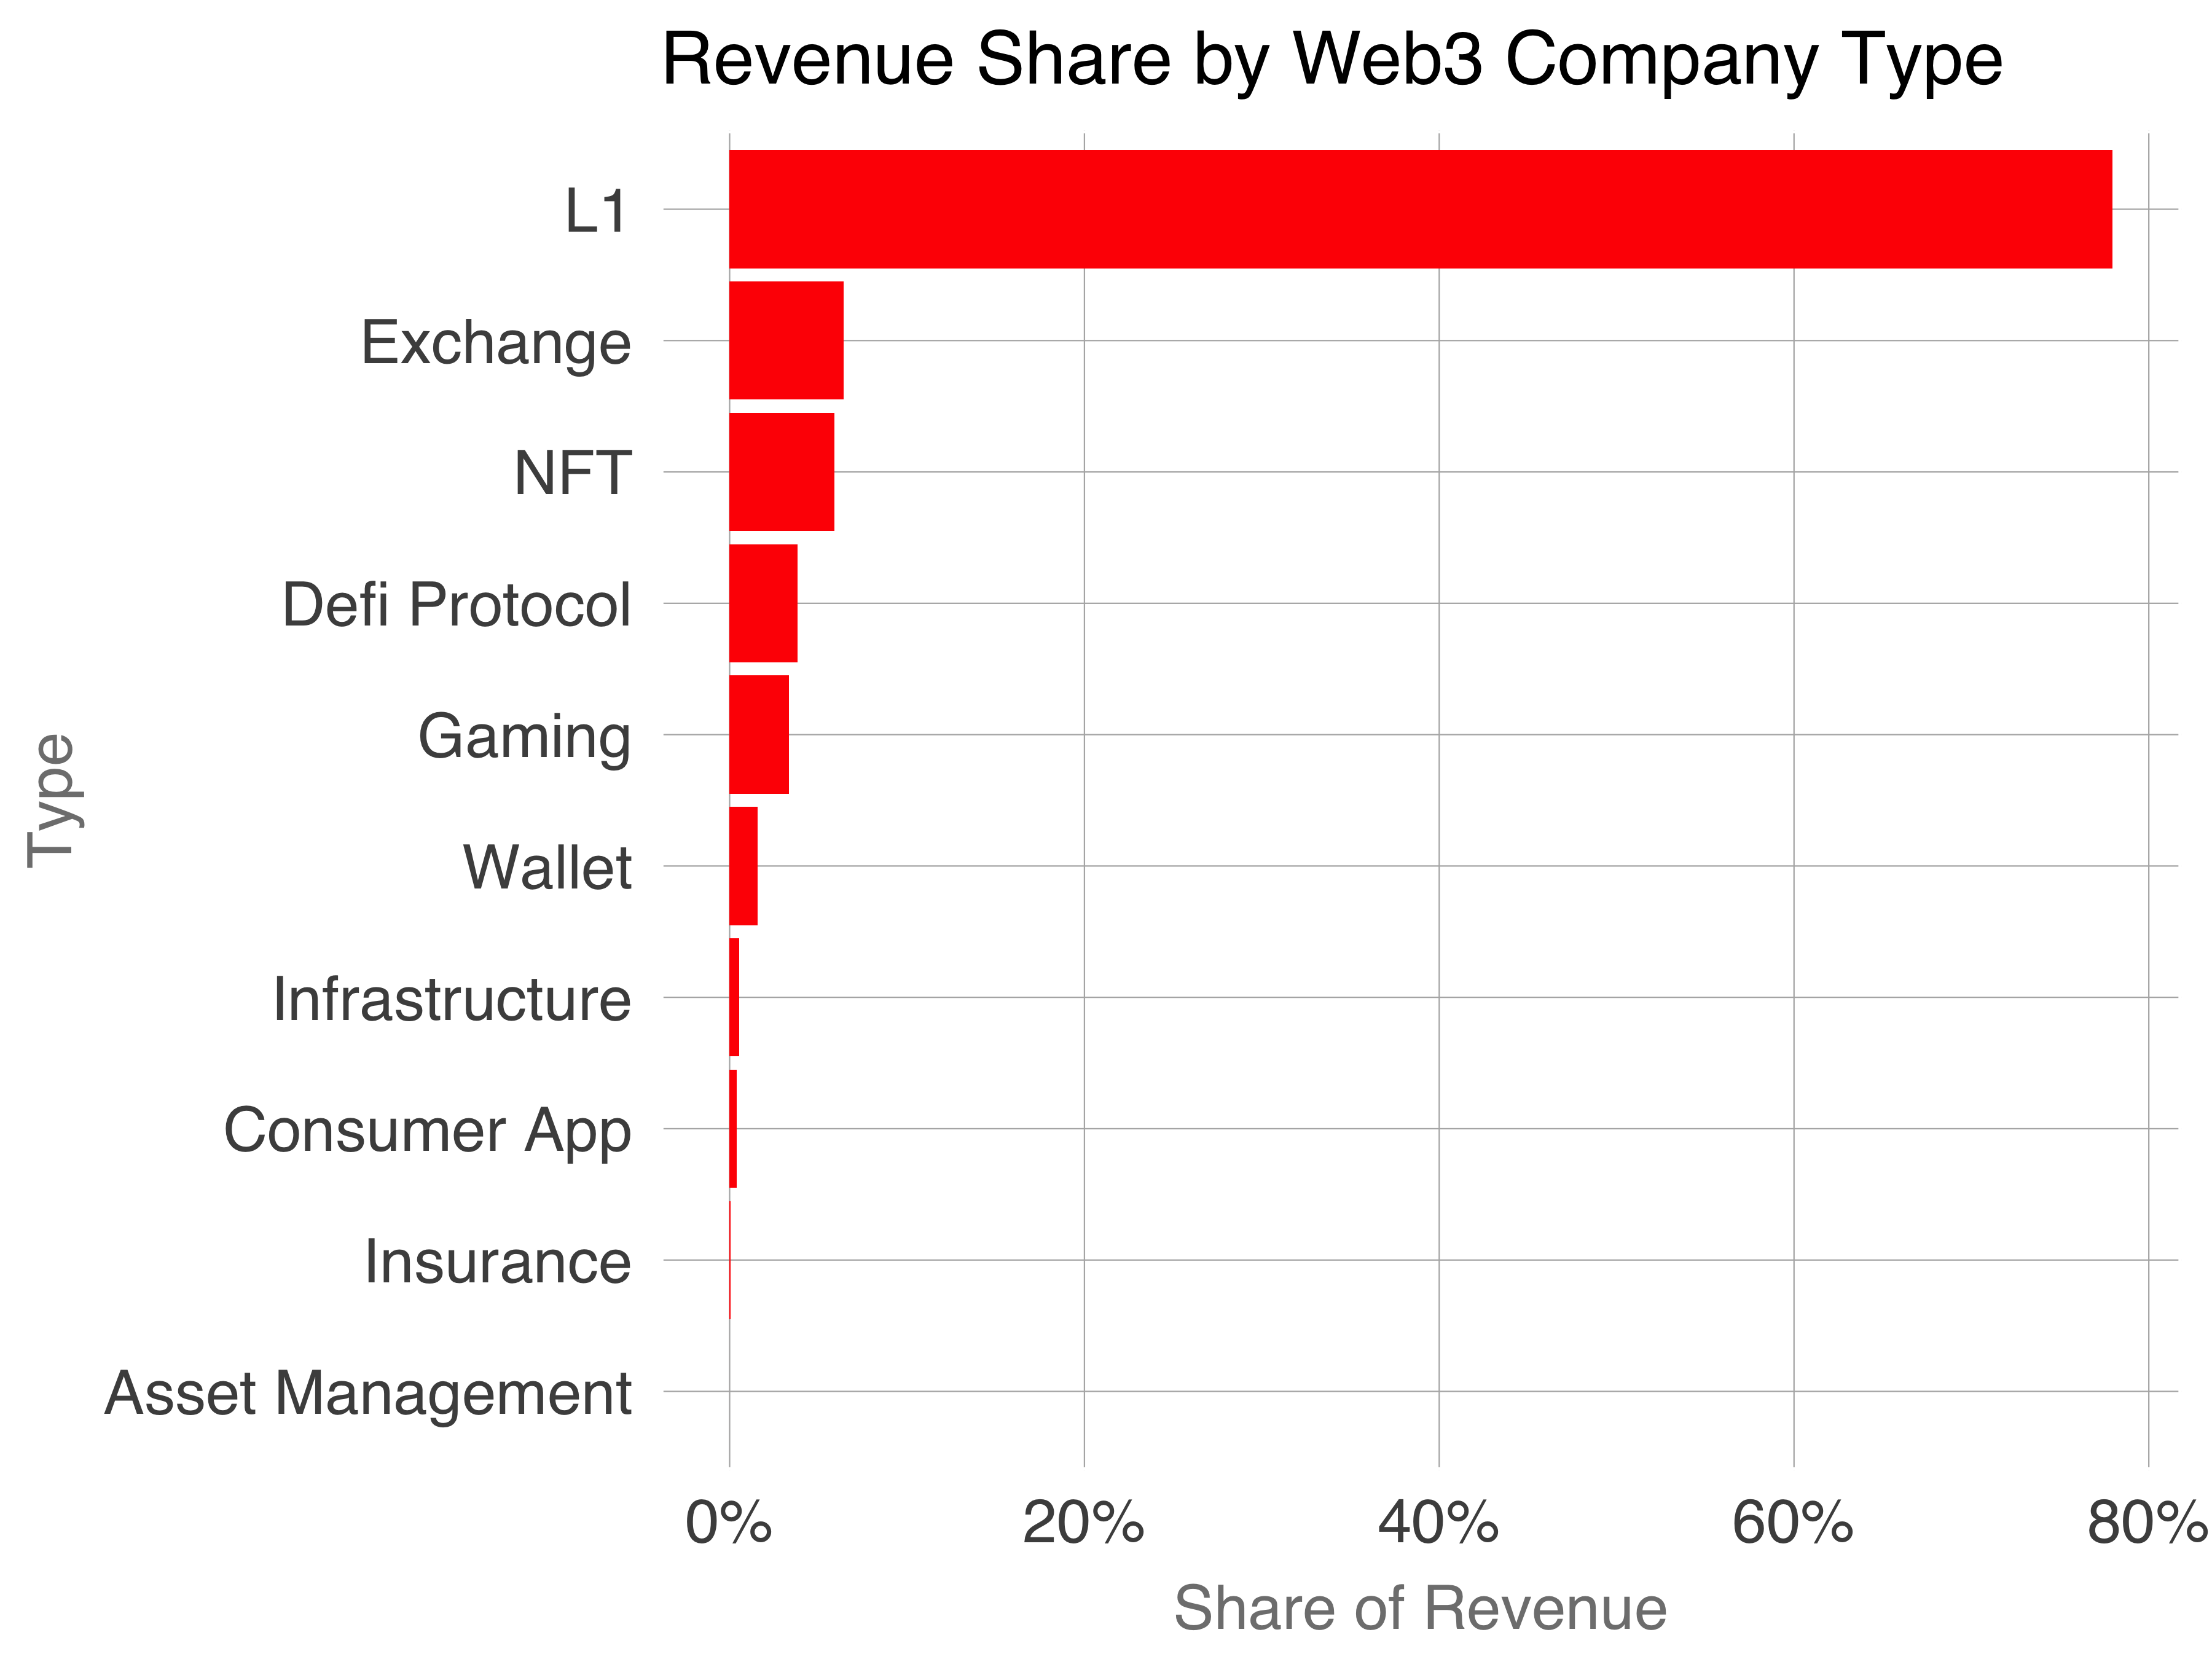
L1s or blockchains, the public databases that record transactions, dominate the revenue share across the top projects producing 78% of revenue. Exchanges place second. Right behind, NFT exchanges rank third. Defi Protocols, which include lending, perps, farming, and swaps, slot in fourth. Gaming, Wallets, Infrastructure, Consumer Apps, Insurance and Asset Management chart negligible share.
| Sector | Revenue Share | Market Cap Share |
|---|---|---|
| L1 | 78% | 88% |
| Exchange | 6.4% | 1.7% |
| NFT | 5.9% | 0% |
| Defi Protocols | 3.8% | 2.1% |
| Gaming | 3.3% | 1.1% |
| Wallet | 1.6% | 0 |
| Infrastructure | 0.5% | 6.6% |
Web3 valuation mechanisms are nascent, fuzzy, and perhaps not-yet-existent. But we can compare the revenue share to circulating market cap share across projects. Deltas between the figures provide insight into which sectors’ tokens investors price at relatively elevated multiples.
L1s command 10 percentage points more market cap share than revenue share, suggesting investors apply a premium to them. Exchanges suffer the reverse: 6.4% revenue share but 1.7% market share. Lower multiples may results from historical precedent: exchanges have traditionally been low-margin businesses.
NFTs and Wallet chalk 0% market share because none of these projects have launched token yet, though I expect that to change soon. Defi Protocols and Gaming’s share of market cap is less than revenue, while Infrastructure companies clock 11x market cap share compared to revenue share, suggesting Infrastructure is a prized category.
A naive view of this table: investors believe in the long-term prospects, defensibility, margin structure, tokenomics, and ultimately attractiveness of certain web3 businesses enough to apply better multiples to different categories, just the way investors apply different valuation multiples to web2 software companies. In reality, the markets are still so new, valuation mechanisms so novel, and price swings driven by social signals that it’s spurious to apply this way of thinking to an embryonic market.
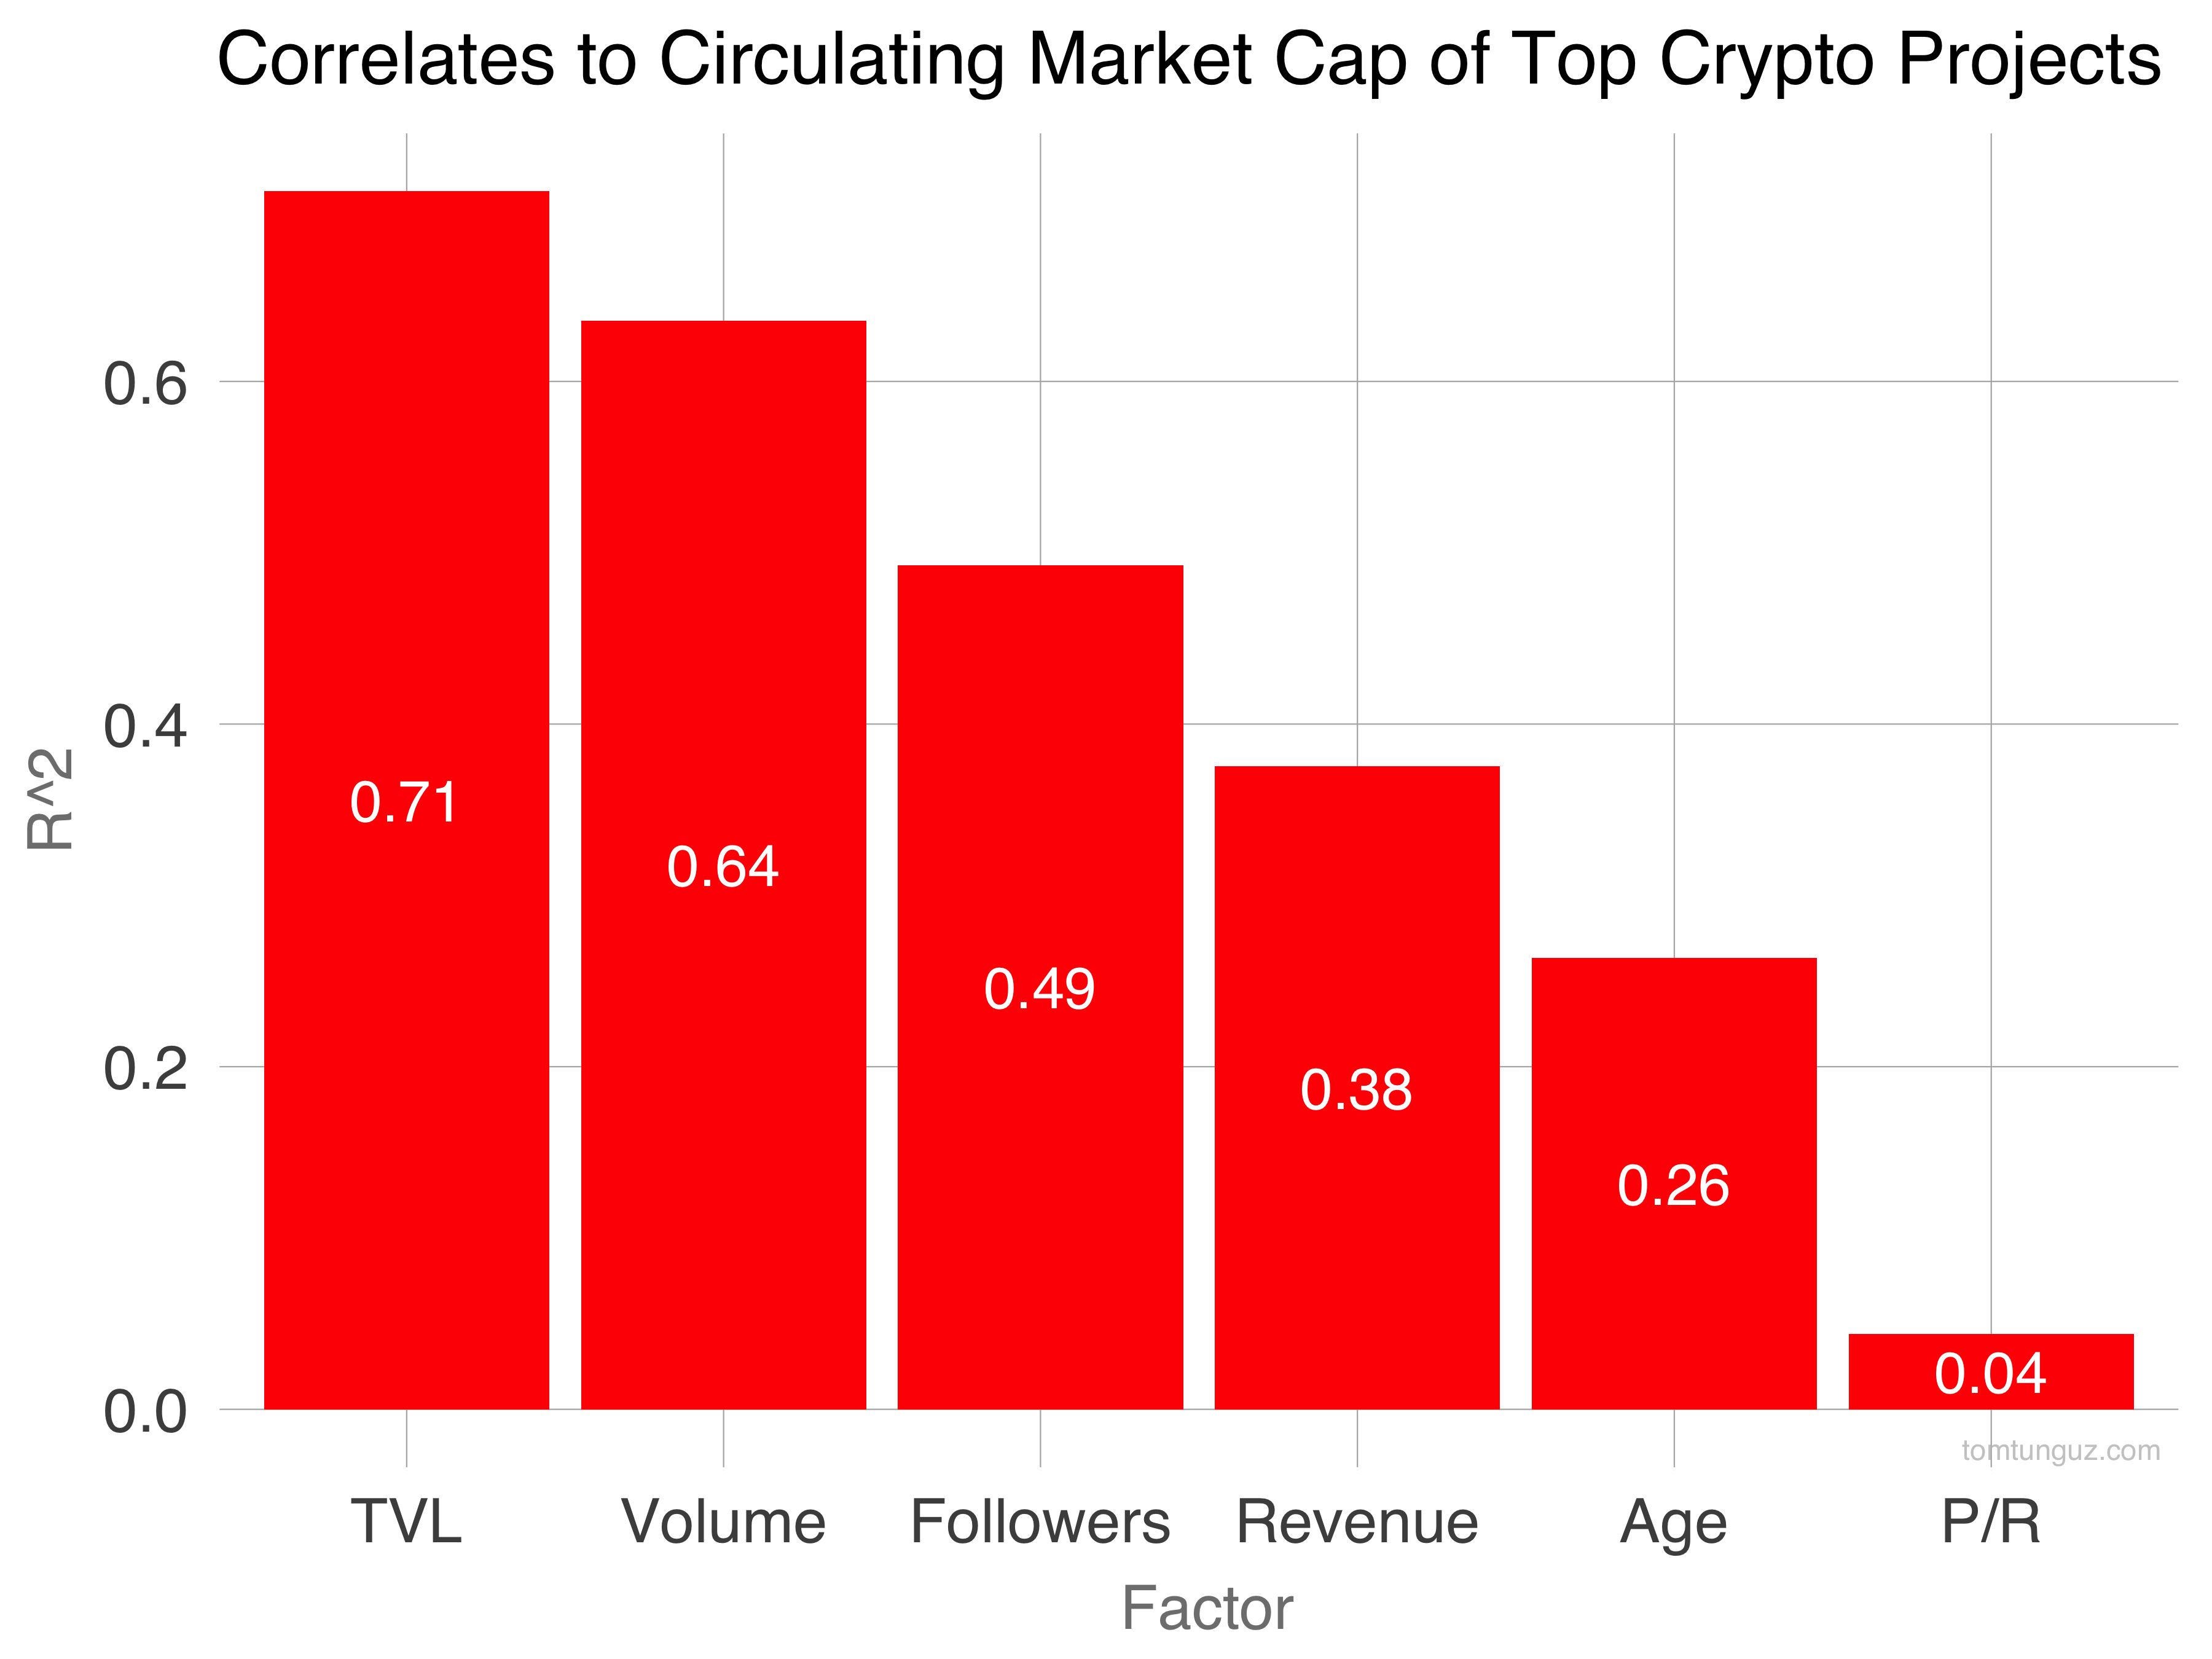
Setting aside sector, TVL (total value locked), trading volume, twitter followers, and revenue are the four most robust correlates to circulating market cap. TVL is at 0.71, which is strong. Volume and market cap are naturally correlated because bigger outstanding token counts should drive more volume in trading. Price to revenue is last in this analysis.
In other words, social proof in crypto is vital, demonstrated both by people voting with their dollars (TVL) and with their attention (Twitter followers). Revenue and age correlate weakly.
A year from now, I expect significant changes in these data points. L1 revenue will remain dominant but other categories will wrest share. Infrastructure companies selling to web3 developers should benefit from a surge in revenue as the web3 ecosystem flourishes. Wallets, the quotidian entry point for web3 users, will exert more influence in the ecosystem, too.
–
A few notes about this analysis. The underlying economics of each of these businesses is very different. The data in this ecosystem is quite early. The categorization is my own. Revenues are only revenues captured by tokens, not dollar revenues for software sales or token payments for services/software. Market cap doesn’t include private company valuations or equity only businesses. On the whole, this analysis is more deKoonings’ broad brushstrokes than Manet’s precise realism.