A few days ago, Simply Business published an infographic and data on the acquisition patterns of Amazon, Apple, Facebook, Google and Yahoo. Looking at that data, I wondered which acquirers pay the most for startups. Ideally, this data provides some negotiating leverage to founders selling their businesses.
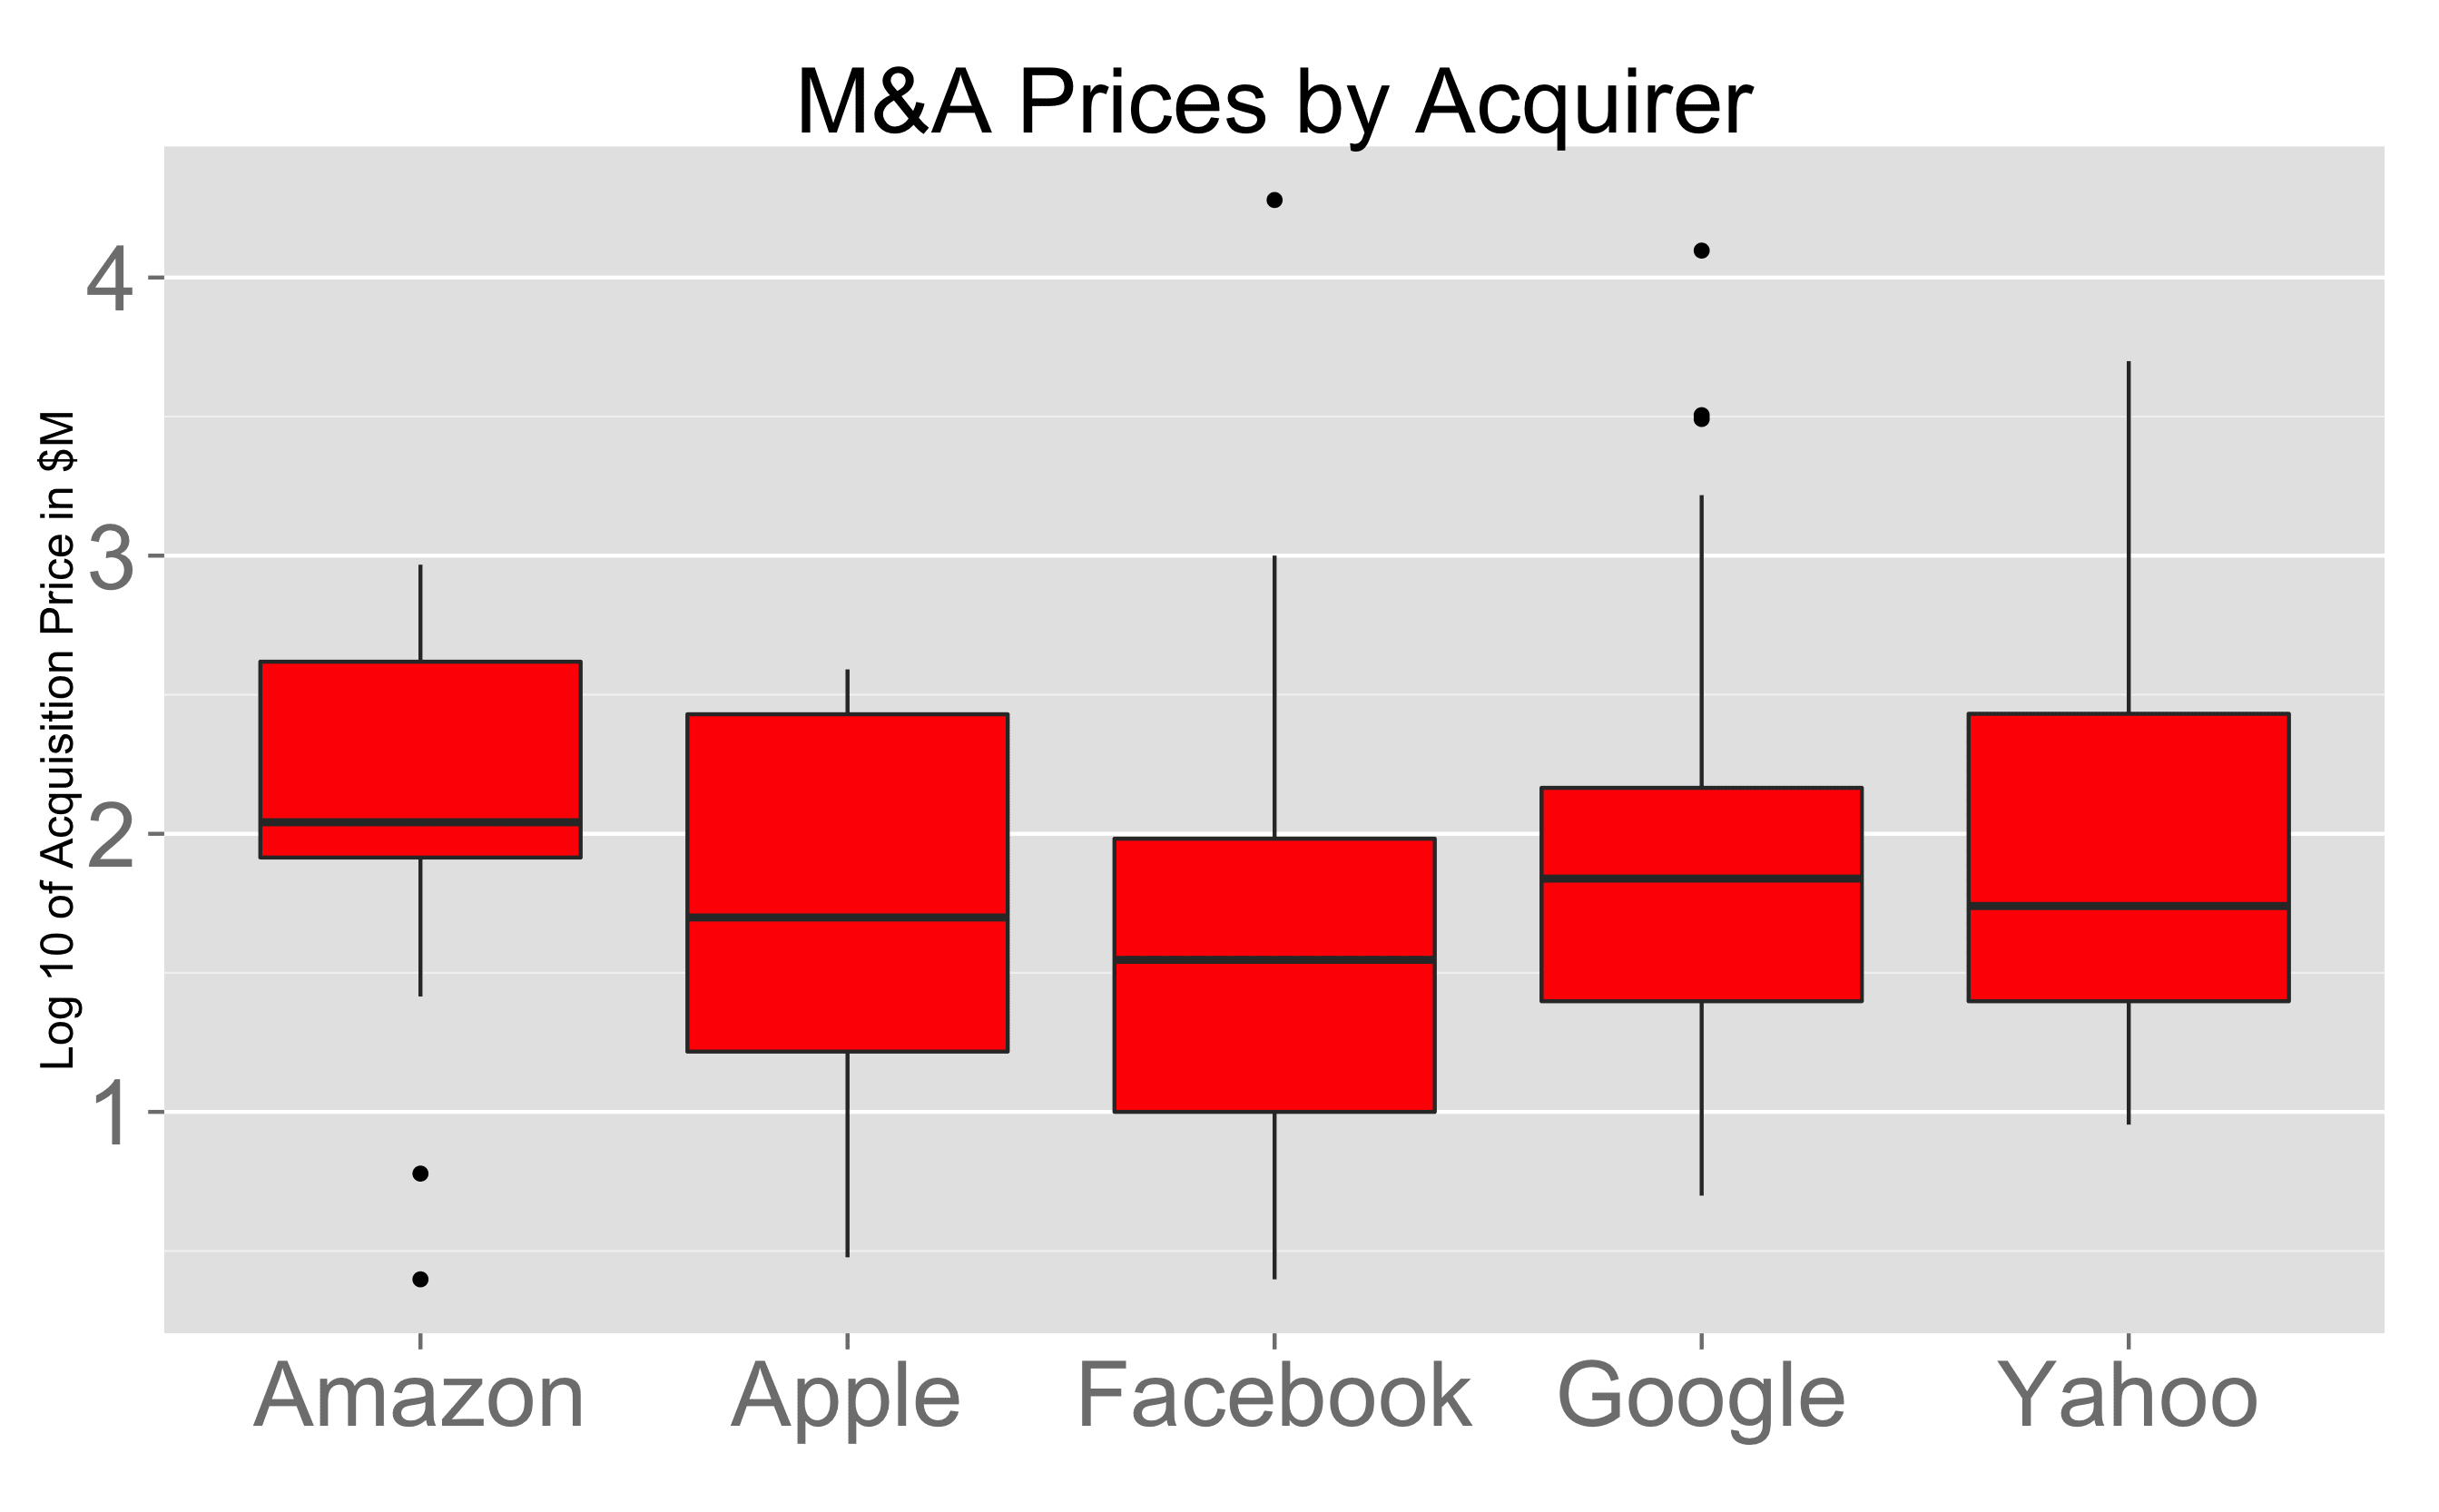
I’ve prepared three charts and a table to tell the story. The first compares the average acquisition prices over the life of each of the tech monoliths. The y-axis is in log scale. A value of 2 means $10M^2 or $100M. On the whole, the average acquisition prices are all in the same ball park. Facebook and Google have outliers, demarcated by dots, which are WhatsApp and DoubleClick, Nest, Motorola for Google.
Next let’s look at M&A activity by company. Google is also by far the most acquisitive company, averaging 11 acquisitions per year since 1999. This is close to twice the pace of Facebook at second place with 6.7. Amazon and Apple are much less acquisitive.
The last column shows the largest acquisition completed by the acquirer. Apple is notable for the contrast between the $40B in cash on its balance sheet and the $390M largest acquisition in the past 15 years. I suppose Apple believe the best innovations come from within.
A note about data quality: in this data set, the large tech companies reported the values of on average 43% of their acquisitions, which are disproportionately the smaller ones. Google discloses the fewest transactions, only 35%.
| Undisclosed | Total | Disclosed | M&A/Year | Max Acq. | $1B+ | |
| Amazon | 22 | 37 | 40.5% | 2.5 | 928 | 0 |
| Apple | 24 | 44 | 45% | 2.9 | 390 | 0 |
| 23 | 41 | 44% | 6.7 | 19,000 | 1 | |
| 93 | 144 | 35% | 11.1 | 12,500 | 4 | |
| Yahoo | 44 | 87 | 49% | 5.7 | 5,004 | 4 |
Now that we have a sense of activity and averages, let’s segment these acquisition histories by transaction size to get a sense of willingness-to-pay. I’ve divided the data into quintiles, five equally sized chunks of acquisitions. These quintiles are <$25M, <$40M, <$100M, <$330M and <$19B.
The chart below shows the number of companies in each quintile by acquirer. Apple and Facebook seem to prefer smaller acquisitions or at least have a disproportionate share of them. Amazon makes fewer smaller acquisitions, prefering $100M+. Google and Yahoo show almost uniform distributions in their M&A.

Next, let’s look at prices within each of these segments. The boxplot below shows the distribution of prices paid by each acquirer in each of the different quintiles. Facebook shows the largest acquisition averages in two of the five quintiles ($40M and $19B), Yahoo shows the largest acquisition average in one quintile ($25M), and Amazon and Apple round out the five.

In the acquihire bucket, Amazon pays the least by a substantial margin. Google and Yahoo seem to offer the best prices; Apple has a lower average but a $15M mean still places Apple 50% above Facebook’s.
In the $25-$40M bucket, Apple and Google seem to have a $30M ceiling on prices here, displaying almost no variance from it. Facebook and Yahoo show more flexibility.
Next in the $40M-$100M bucket, Facebook and Google acquire throughout the spectrum. Amazon pays a premium, while Apple and Yahoo bargain-shop.
In the $100-$330M segment, Amazon and Apple show the highest averages at around $250M, while Google and Yahoo have means of around $150M. Note the non-zero y-axis here, which artifically accentuates the differences. This is a bug in the plotting library I use.
Last, in the billion-dollar bucket, the data is dominated by exceptions: WhatApps, DoubleClick, Overture, YouTube, Motorola. It’s hard to draw a conclusion.
In summary, Amazon doesn’t seem to make acquihires, while Yahoo, Facebook and Google seem to acquire quite a few. Neither Apple nor Amazon make large acquisitions, while Yahoo and Google have 80% market share of $1B+ M&A in this data set. There seems to be no consistent pattern on M&A willingness-to-pay across these segments, so it’s hard to recommend a universal strategy to maximize acquisition price based on past behavior aside from speaking with the corp dev teams who tend to be most active in a given category or transaction size.
This is just one way of looking at the data. I’ve tried to tell one story using a post-hoc analysis, but I suspect much of the variation in the acquisition data is driven by individual companies and transactions rather than a long-term acquisition strategy. If you’d like to perform your own analysis, you can download the data set I used here.