3 minute read / May 3, 2015 /
Which is a More Efficient Way to Build a SaaS Startup - Bottoms Up or Top Down?
An entrepreneur last week asked me if bottoms up businesses are more efficient software companies than top down sales processes. Enabled by web and mobile app distribution, the bottoms up software business acquires individual users, small teams and eventually departments. The top down model sells to a C-level executive (CEO, CIO, CFO) and captures the relevant part of the organization through one sales process.
Because the bottoms up processes tend to rely on seemingly less expensive customer acquisition techniques like content marketing and in-product up-sell initially, this founder suggested, quite reasonably I thought, that bottoms up companies are more efficient.
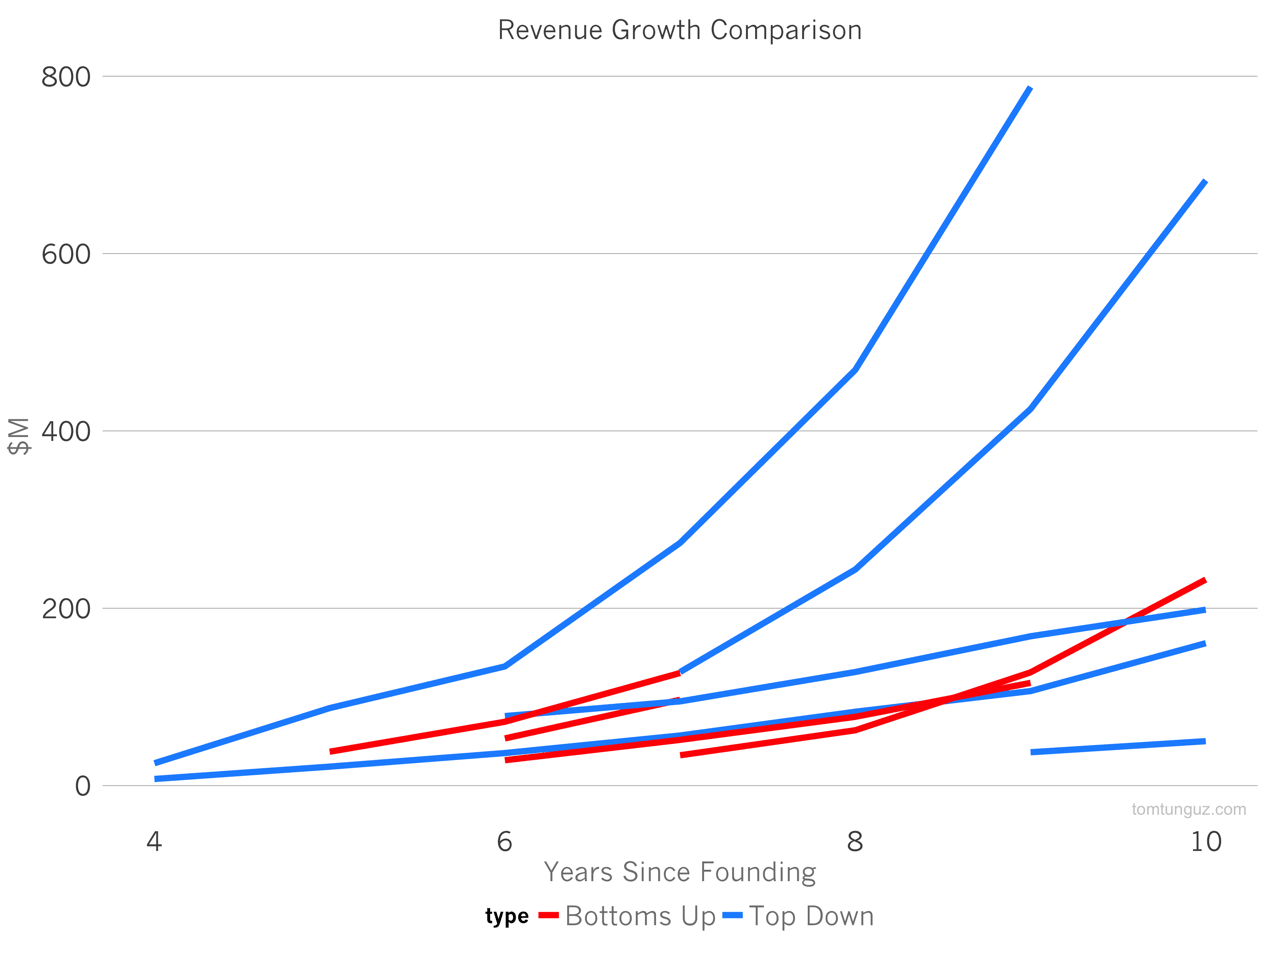
In this post, we’ll compare the efficiencies of bottoms up and top down companies across four dimensions: revenue growth, gross margin, profitability, and capital raised. I curated a bucket of companies for each category. Zendesk, Hubspot, New Relic and Tableau represent the Bottoms Up bucket. Workday, Responsys, Demandware, Taleo and ServiceNow in the Top Down bucket.
The revenue chart above shows the individual revenue growth trajectories of the companies in each basket, demarcated by color: red for Bottoms Up and blue for Top Down. Top Down companies ServiceNow and Workday have tracked the two fastest and highest magnitude growth curves. Zendesk is tracing ServiceNow’s revenue trajectory. Using statistical analysis, however, we can’t prove a difference between the revenue growth patterns of Bottoms Up and Top Down companies.
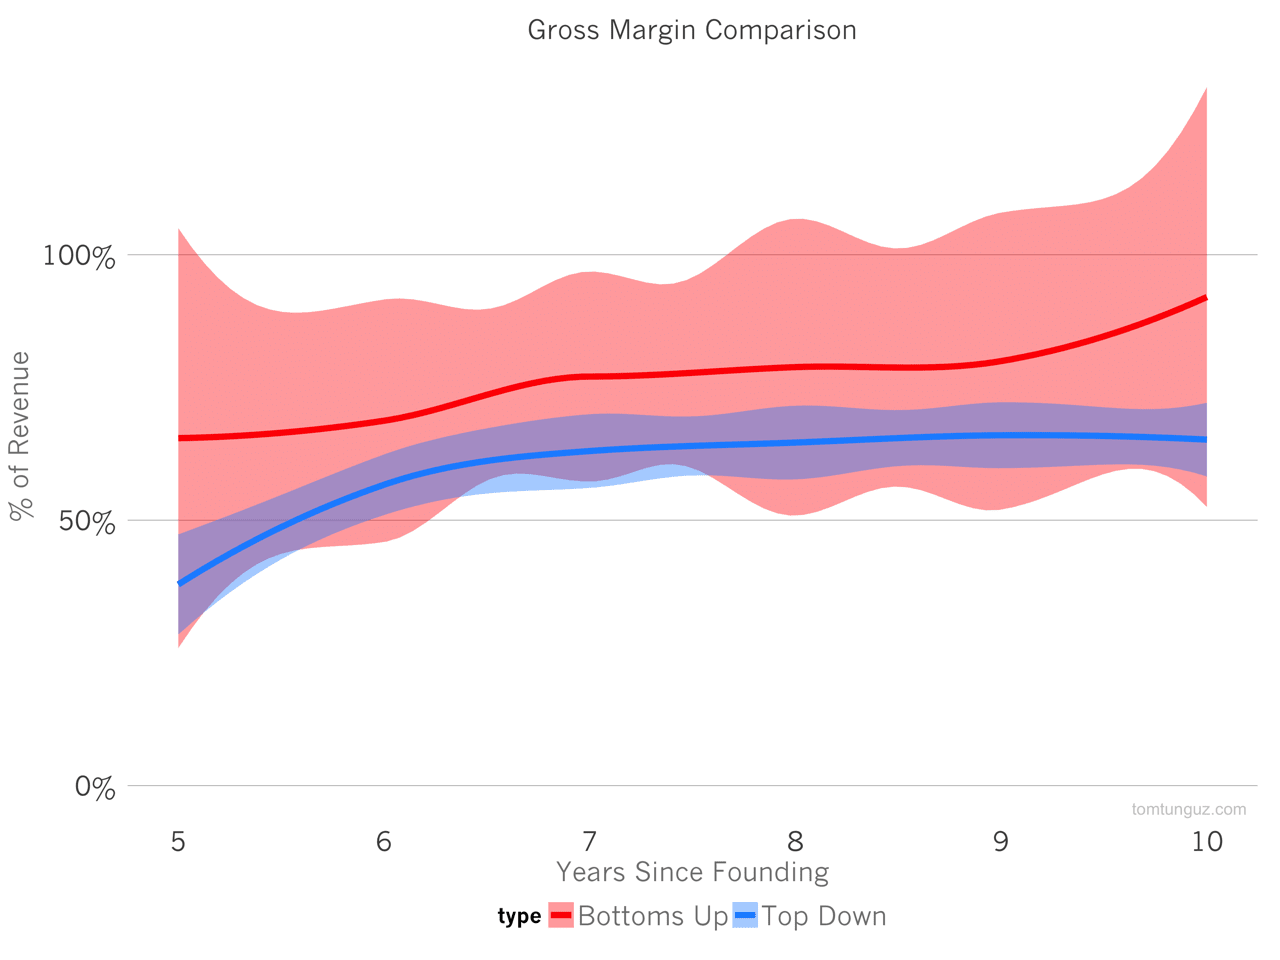
Let’s examine the gross profit of each type of business. Top Down companies should offer more professional services, which should depress gross margins compared to Bottoms Up companies. The chart above shows the average value for each type of company as a line, and the area depicts the value of one standard deviation out from the mean.
The Bottoms Up companies do seem to exhibit a 15 percentage point advantage in gross margin, which is consistent with the theory that professional services depress Top Down approaches. The variance of the Bottoms Up gross margin is substantially greater than the Top Down companies which have far greater consistency in their gross margin profiles. However, again, the data isn’t strong enough yet to be statistically significant.
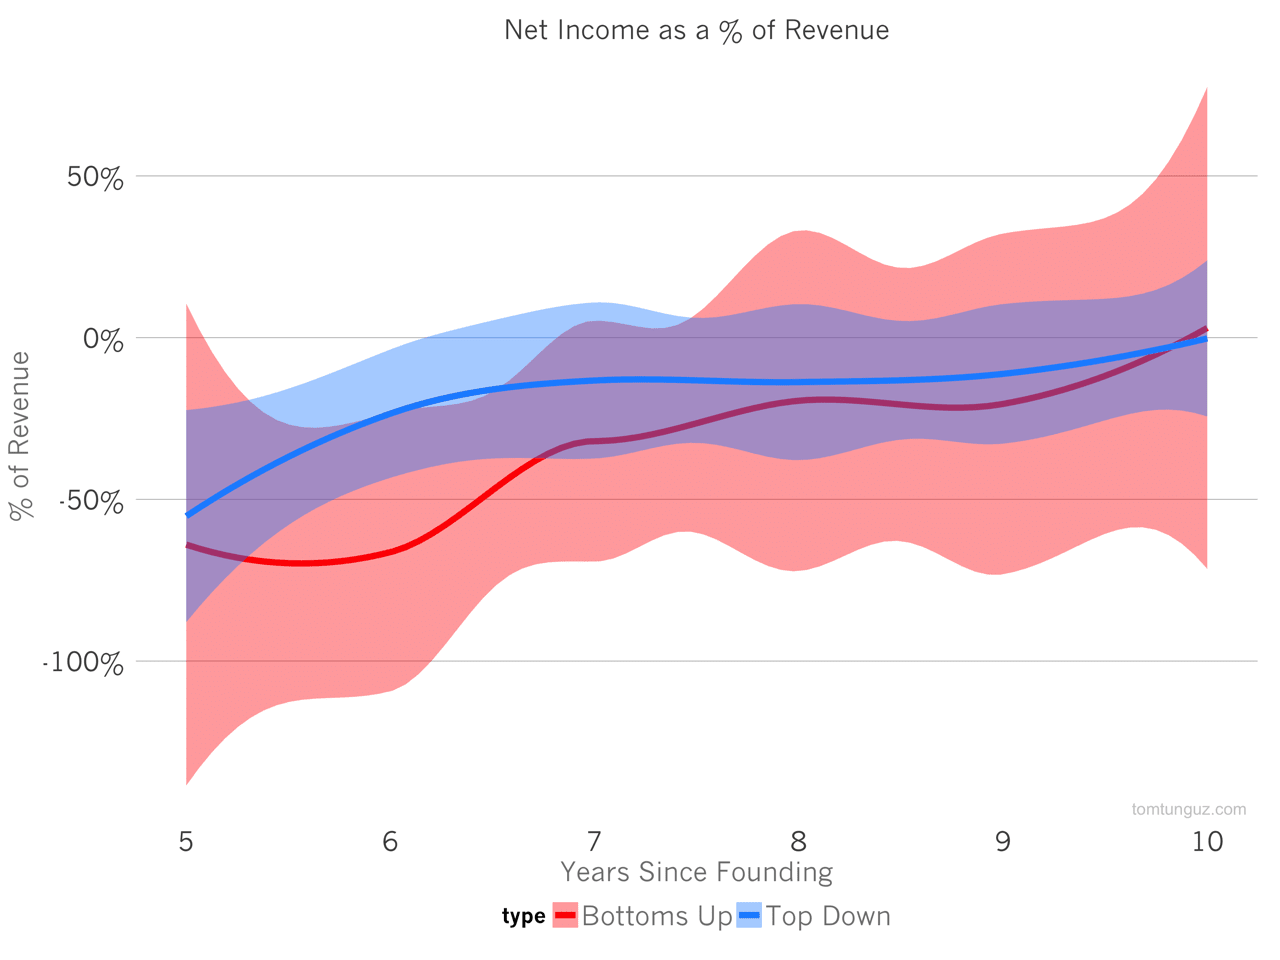
Net Income/Profitability seems to be roughly equal for the two types of companies. Both types of companies seem cross the profitability threshold around year 10. Bottoms Up companies exhibit greater losses in year 6, and generally speaking see a greater variance in profitability.
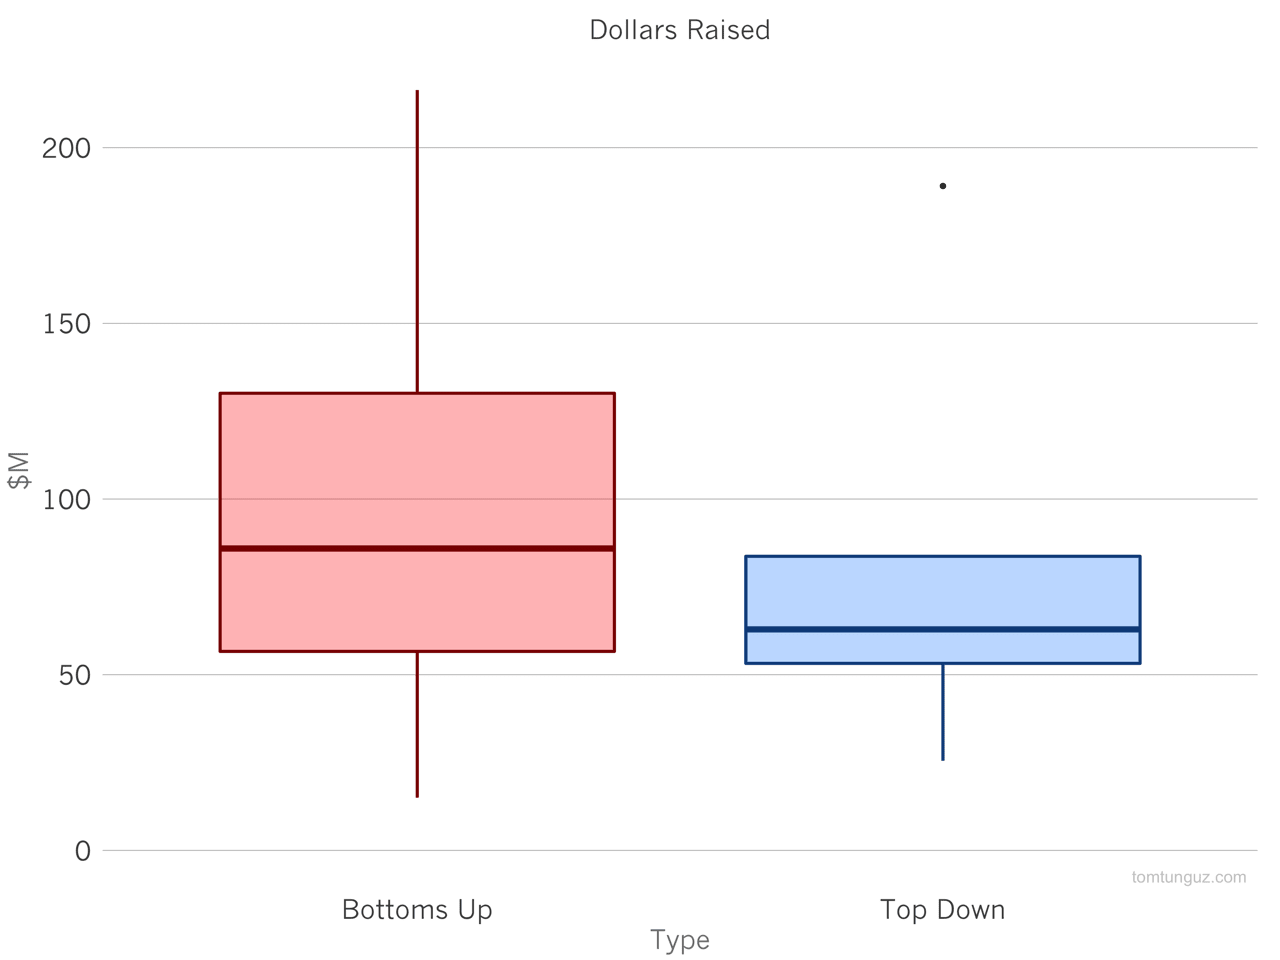
Last, the box plot above shows the distribution of capital raised by company type. Surprisingly, Bottoms Up companies tend to raise more. The dollars raised analysis is challenged by a few different factors. First, not all these companies raised money because they needed it, so venture capital raised isn’t a pure proxy for cash burn. Second, the cyclicality of the venture market has a greater impact on total dollars raised. For example, New Relic’s first two rounds were $3.4M and $8.9M, both of which occurred in 2008, would likely have been substantially larger today.
Here are the individual data points:
| Bottoms Up | Top Down | ||
|---|---|---|---|
| Company | $M Raised | Company | $M Raised |
| New Relic | 216 | Workday | 189 |
| HubSpot | 101 | ServiceNow | 84 |
| Zendesk | 71 | Responsys | 63 |
| Tableau | 15 | DemandWare | 53 |
| Taleo | 26 | ||
Ultimately, the data shows great businesses can be built using both sales methodologies. We can’t prove with this data set that there are meaningful differences in any of four measures of startup efficiency including revenue growth, gross margin, profitability or cash raised. Perhaps that will change as the many private software companies go public and we can analyze more data from the relatively newer Bottoms Up approach. But for now, we can say both approaches produce equally efficient companies.