I’ve been promoting my Twitter account since October 2012 in effort to better understand social media content marketing and to promote that great vanity metric, Twitter follower count.
At the outset, I promoted my account and links to blog posts. I prize followers more than one time visits to a blog, because the long term marketing relationship provides many chances to bring someone to my blog. Promoting links sends traffic to a single blog post, but doesn’t convert to followers with a very high rate.
I spent $10 per day for 312 days and set my max bid to $2.5 per follower for people in the Bay Area. On average, I spent $9.28 per day to acquire 5.3 followers for an average cost-per-follower (CPF) of $1.73. Below is the detailed data:
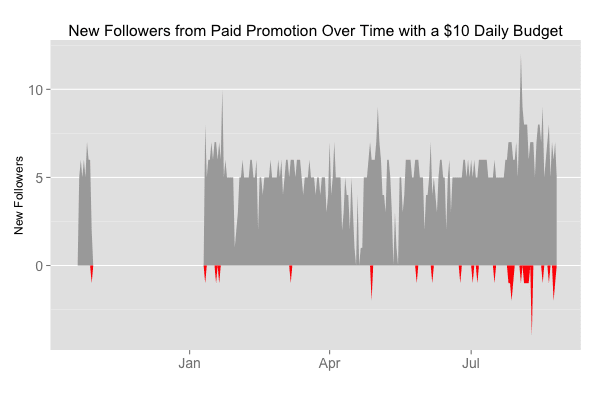
New followers are marked in gray and lost followers, those who unfollow me, are marked in red. On average, I gain 5 followers each day and lose 0.15 followers (that I paid to acquire).
The unfollow rate has been increasing dramatically in the past few months from about 0.5% in February to 7.6% in August. This is a worrisome trend because it implies a decrease in targeting effectiveness and an increase in cost per follower (CPF).
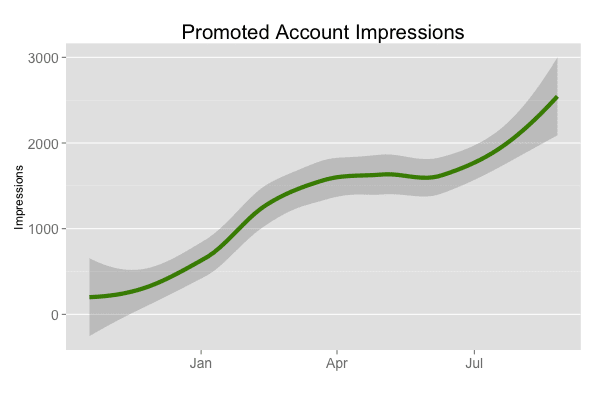
The number of impressions for my promoted account has increased by more than 5x since I started using the ads product in late 2012. This is a positive for me. The more people who see my name, the better, provided I don’t have to pay more. But it means that fewer ad impressions generate revenue for Twitter.
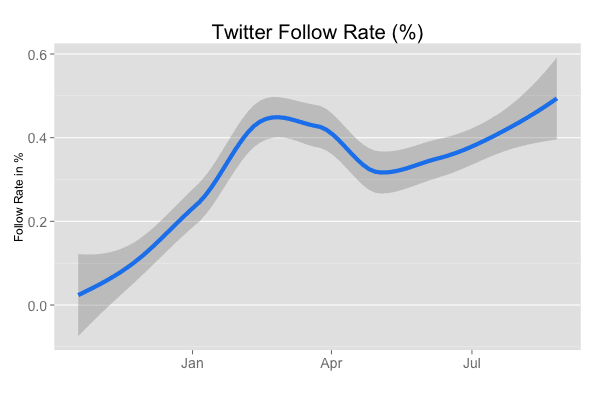
Over the same time, the follow rate has improved by about 5x. Because the follower growth rate has remained relatively steady, the data implies that the number impressions required to garner a follower has increased by 5x in just a few months and Twitter is showing a greater number of impressions to the same users, rather than diffusing those impressions over many more users.

Ultimately, these figures boil down to a cost to acquire a follower. The red line above is the smoothed gross cost to acquire a Twitter follower. Despite the spike in April, the cost has been decreasing steadily. The blue line, which is the cost net of the lost followers, has also been falling. The increasing number of impressions required to win a follower don’t factor into the CPF calculation thankfully. These lines are smoothed to show the trends.
In future analyses, I’d like to measure the interaction rate of paid vs organic followers to determine the downstream value of these users. I suspect their retweet patterns differ quite substantially. Only with that data would it be possible to truly understand the marketing return on investment of Twitter ad spend.
Overall, Twitter’s ad platform seems to be a great way of building a social media audience and if the estimated ROI for your content marketing campaign can justify a $1.50 cost per follower, then it’s well worth the investment.